FIGURE

Figure 4

ID
ZDB-FIG-210201-10
Publication
Babi? et al., 2021 - Utilization of the zebrafish model to unravel the harmful effects of biomass burning during Amazonian wildfires
Other Figures
All Figure Page
Back to All Figure Page
Figure 4

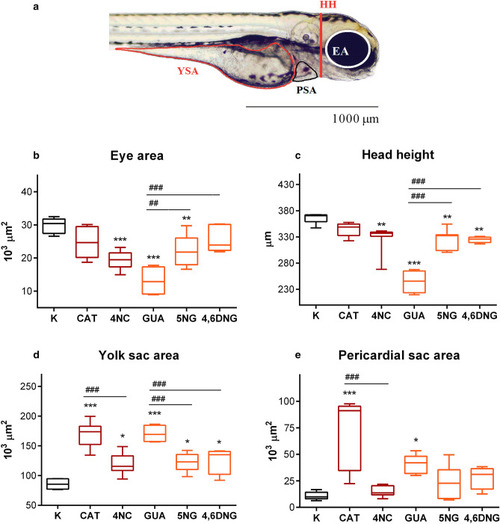
Morphometric measurements of D. rerio larvae after 96-h exposure to tested compounds (CAT, 4NC, GUA, 5NG, and 4,6DNG) and control (C). (a) Lateral view showing eye area (EA), head height (HH), yolk sac area (YSA), and pericardial sac area (PSA). Scale bar = 1000 µm. Morphometric parameters are presented by their mean value (be; n = 15). The symbol * indicates a significant difference between tested samples and negative control (*p < 0.05; **p < 0.01; ***p < 0.001). Mean values sharing common letters indicate significant differences among different tested compounds (*p < 0.05). A line within the box represents the median value, while the boundaries of box-plot indicate 25th and 75th percentiles. Whiskers above and below the box indicate 10th and 90th percentiles. Statistical analysis and data presentation were prepared using GraphPad Prism software version 6.0 (https://graphpad-prism.software.informer.com/6.0/), while visualization and morphometric measurements were performed using Microsoft AnalySIS Soft Imaging System software (https://www.olympus-lifescience.com/en/support/downloads/).

Expression Data

Expression Detail
Antibody Labeling
Phenotype Data
Fish:
Conditions:
Observed In:
Stage: Day 4

Phenotype Detail
Acknowledgments
This image is the copyrighted work of the attributed author or publisher, and ZFIN has permission only to display this image to its users. Additional permissions should be obtained from the applicable author or publisher of the image. Full text @ Sci. Rep.