
- Title
-
Modular transient nanoclustering of activated β2-adrenergic receptors revealed by single-molecule tracking of conformation-specific nanobodies
- Authors
- Gormal, R.S., Padmanabhan, P., Kasula, R., Bademosi, A.T., Coakley, S., Giacomotto, J., Blum, A., Joensuu, M., Wallis, T.P., Lo, H.P., Budnar, S., Rae, J., Ferguson, C., Bastiani, M., Thomas, W.G., Pardon, E., Steyaert, J., Yap, A.S., Goodhill, G.J., Hilliard, M.A., Parton, R.G., Meunier, F.A.
- Source
- Full text @ Proc. Natl. Acad. Sci. USA
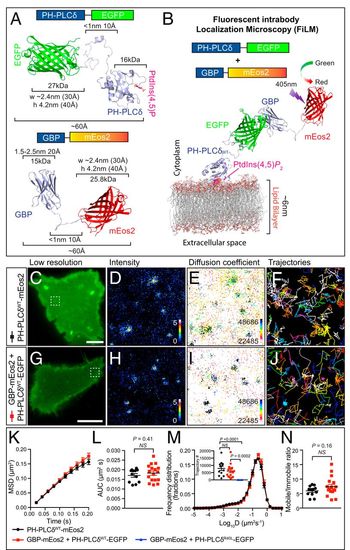
Single-particle detection of PH-PLCδWT-EGFP by GBP-Nb-mEos2 using the FiLM technique. (A) Expression of PH-PLCδWT-EGFP (GFP target) (Top) together with GBP-mEos2 (Bottom) facilitates single-particle tracking in cellular transfection systems. (B) Illustration of the principle of FiLM using PH-PLCδWT-EGFP target at the plasma membrane. (C) A representative PC12 cell in TIRF shows the green fluorescence of PH-PLCδWT-mEos2 prior to photoconversion. (Scale bar, 5 μm.) (The region of interest, defined by the white box, is used for D–F.) Superresolution imaging was performed at 50 Hz with analysis of movies generating (D) sptPALM average intensity map, (E) diffusion coefficient distribution (darker colors represent lower mobility), and (F) trajectory map (color coded by time; warmer colors acquired later into the acquisition). (G) PC12 cell expressing PH-PLCδWT-EGFP and GBP-mEos2 (H–J as per D–F). (Scale bar, 5 μm.) (K) Analysis of single-particle tracking was expressed as the MSD as a function of time, (L) AUC, (M) frequency distribution of the diffusion coefficient (Inset: trajectory number), and (N) mobile-to-immobile ratio (n = 12 and 17, cells for each condition from three independent experiments, PH-PLCδR40L-EGFP n = 10). Protein structures were generated in PyMOL. Statistics of AUC and mobile-to-immobile ratio were performed using an unpaired Student’s t test. The differences between the two conditions were all nonsignificant (NS). Nonparametric ANOVA Kruskal−Wallis test with Dunn’s multiple comparisons test was used to compare trajectory numbers between the three conditions. |
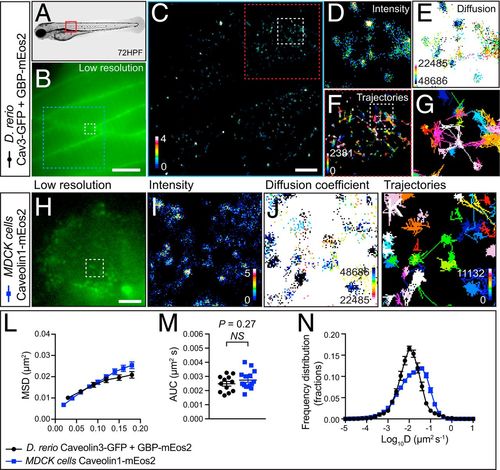
Single-particle detection of Cav3-GFP in zebrafish by GBP-mEos2 using the FiLM technique. (A) Representative image of a 72-hpf zebrafish embryo. (B) Low-resolution image of the green fluorescence observed within skeletal muscle fibers of a zebrafish expressing Cav3-GFP as well as GBP-mEos2 at the location indicated by the red box in A. (Scale bar, 10μm). Superresolution imaging was performed at 33 Hz with analysis of movies generating (C and D) an average intensity map, (E) a diffusion coefficient map (darker colors represent lower mobility), and (F) a trajectory map (color coded by time; warmer colors acquired later into the acquisition). (Scale bar, C, 2.5 μm). (G) Illustrates the dual confinement trajectories within the region of interest in F. Red box (8 μm × 8 μm). (H) Low-resolution image of mEos2-Cav1 in transfected MDCK cells prior to photoconversion with a 405-nm laser. The region of interest is indicated with a white box (2 μm × 2 μm) in H. Superresolution imaging was performed at 50 Hz and analysis of movies generated (I) average intensity map, (J) diffusion coefficient map, and (K) trajectory map. Analysis of single-particle tracking was expressed as the (L) MSD as a function of time; (M) AUC, and (N) frequency distribution of the diffusion coefficient (n = 12 zebrafish from three independent injections; n = 15 MDCK cells from three independent experiments). Statistics of AUC were performed using an unpaired Student’s t test. |
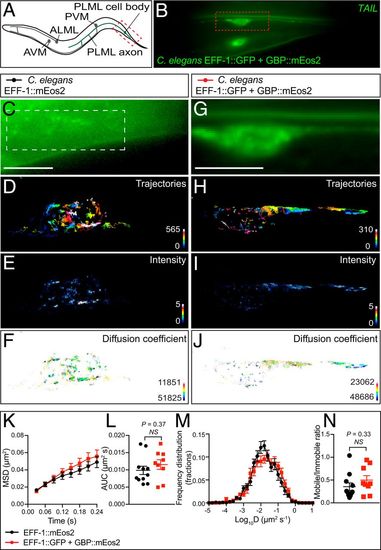
Single-particle detection of EFF-1::GFP in C. elegans by GBP-mEos2 using the FiLM technique. (A) Illustration showing the location of the mechanosensory neurons in C. elegans driven by Pmec-4 promoter expression. The portion of the PLM mechanosensory neuron imaged in these experiments is delineated by a red box. (B) Low-resolution image of the tail of a representative animal showing both left and right PLM mechanosensory neurons expressing Pmec-4::eff-1::gfp and Pmec-4::mEos2-N1-GBP-Nb. (C) Representative C. elegans PLM mechanosensory neuron in TIRF, expressing Pmec-4::eff-1::Eos2 taken prior to photoconversion with a 405-nm laser. (Scale bar, 5 µm.) Region of interest defined by the white box is used for D–F. Superresolution imaging was performed at 33 Hz and analysis of the movies generated (D) a trajectory map (color coded by time; warmer colors acquired later into the acquisition), (E) an average intensity map, and (F) a diffusion coefficient map (darker colors represent lower mobility). (G) C. elegans expressing Pmec-4::eff-1::gfp and Pmec-4::mEos2-N1-GBP-Nb (Scale bar as in C) (H–J as per D–F). Analysis of single-particle tracking was expressed as the (K) MSD as a function of time, (L) AUC, (M) frequency distribution of the diffusion coefficient, and (N) mobile to immobile ratio (n = 11 and 9, animals for each condition from three independent experiments). Statistics of AUC were performed using an unpaired Student’s t test, and a nonparametric Mann−Whitney U test was used to compare the mobile-to-immobile ratios. |
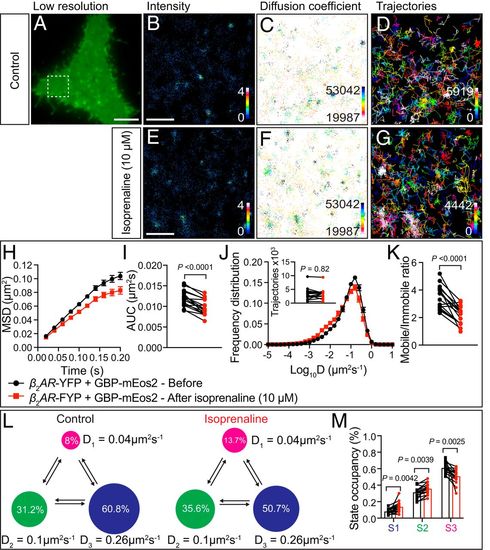
Single-particle detection of β2-AR-YFP by GBP-mEos2 using the FiLM technique before and after isoprenaline addition. (A) A representative PC12 cell in TIRF shows the green fluorescence of β2-AR-YFP and GBP-mEos2 prior to photoconversion. (Scale bar, 5 μm.) (The region of interest, defined by the white box, is used for B and D).) Superresolution imaging was performed at 50 Hz and analysis of the movies generating (B) average intensity map; (C) diffusion coefficient distribution (darker colors represent lower mobility) and (D) trajectory map (color coded by time; warmer colors acquired later into the acquisition). (Scale bar, 1 μm.) (E–G) The region of interest of cell above following isoprenaline treatment (10 µM) (E–G as per B–D). (H) Analysis of single-particle tracking was expressed as the MSD as a function of time, (I) AUC, (J) frequency distribution of the diffusion coefficient (Inset: trajectory number); (K) mobile-to-immobile ratios (n = 16, from three independent experiments). (L and M) Hidden Markov modeling to infer mobility parameters of β2-AR-YFP trajectories. (L) A three-state model with the inferred apparent diffusion coefficients and state occupancies are represented. Each state is illustrated by a colored circle (state 1, immobile, magenta; state 2, intermediate, green; state 3, fast mobile, blue), with the area proportional to the state occupancy. (M) Comparison of state occupancies inferred from β2-AR-YFP trajectories (n = 16 sets, 16 cells from three independent experiments). Statistics of the AUC, mobile-to-immobile ratio, and state occupancy were performed using a paired Student’s t test, and trajectory number comparison was made using paired nonparametric Wilcox test. |
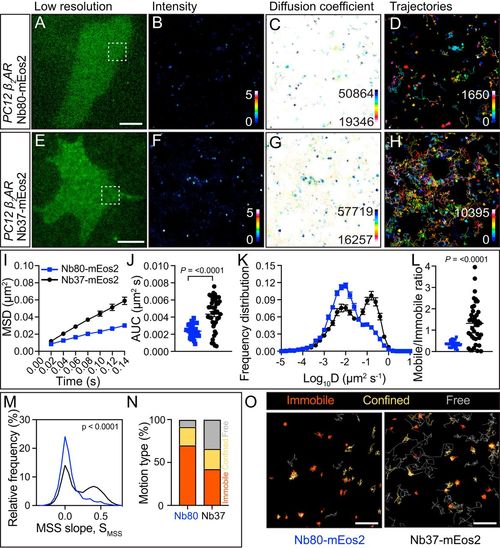
Single-particle detection of Nb80-mEos2 and Nb37-mEos2 in PC12 cells using the FiLM technique. (A) Representative PC12 cell, in TIRF, of the green fluorescent Nb80-mEos2 intrabody that targets the active conformation of β2-AR taken prior to photoconversion with a 405-nm laser. (Scale bar, 5 μm.) The region of interest is defined by the white box in A Superresolution imaging was performed at 50 Hz, and analysis of movies generated (B) average intensity map, (C) diffusion coefficient map distribution (darker colors represent lower mobility), and (D) trajectory map (color coded by time; warmer colors acquired later into the acquisition). (E) PC12 cell expressing Nb37-mEos2 (E–H as per A–D). Analysis of single-particle tracking was expressed as the (I) MSD as a function of time, (J) AUC, (K) frequency distribution of the diffusion coefficient, and (L) mobile-to-immobile ratio (N = 31 and 41 cells for Nb80 and Nb37, respectively). Statistics of AUC and mobile-to-immobile ratio were performed using a Student’s t test. (M) Distribution of the moment scaling slope of trajectories (n = 6,291 Nb80-mEos2 trajectories from 31 cells and 17,841 Nb37-mEos2 trajectories from 41 cells). (N) Percentage of immobile, confined, and free motion type identified using MSS. (O) Trajectories annotated based on different motion types. (Scale bar, Nb80, 1 μm; Nb37, 0.7 μm.) |
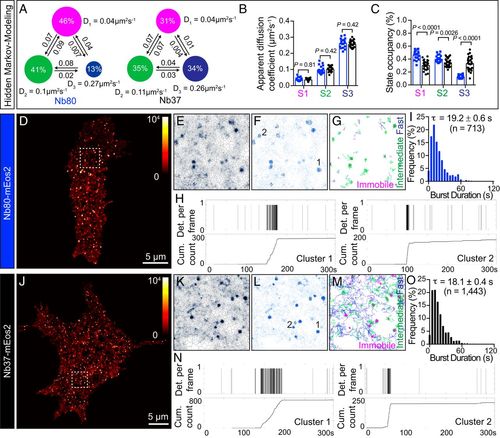
Dynamics properties of endogenous activated β2-AR and Gαs-coupled GPCR nanoclusters. (A–C) Individual trajectories of the single-particle tracking data of Nb80-mEos2 and Nb37-mEos2 were analyzed using HMM to infer mobility parameters. (A) A three-state model with the inferred apparent diffusion coefficients and state occupancies represented. Each state is illustrated by a colored circle (state 1, immobile, magenta; state 2, intermediate, green; state 3, fast mobile, blue), with the area proportional to the state occupancy. (B) Comparison of apparent diffusion coefficients of each state inferred from Nb80-mEos2 and Nb37-mEos2 trajectories. (C) Comparison of state occupancies inferred from Nb80-mEos2 and Nb37-mEos2 trajectories (n = 28 sets, 34 cells for Nb37-mEos2, n = 19 sets, 31 cells for Nb80-mEos2). Statistics of apparent diffusion coefficient and state occupancy were performed using a Student’s t test with Welch’s correction. (D–N) The dynamics of individual nanoclusters assessed using a combination of Voronoï-based cluster detection and tcPALM analyses in live PC12 cells. (D and J) Representative superresolution images of (D) Nb80-mEos2 and (J) Nb37-mEos2. (E and K) Voronoï diagrams of (E) Nb80-mEos2 and (K) Nb37-mEos2 detections. (F and L) Nanoclusters (black outline) detected by (F) Nb80-mEos2 and (L) Nb37-mEos2 were identified using Voronoï-based tessellation algorithm. (G) Nb80-mEos2 and (M) Nb37-mEos2 trajectories displaying immobile, intermediate, and fast motion patterns inferred using HMM. (H and N) Representative time series of detections from β2-AR nanoclusters detected using (H) Nb80-mEos2 and (N) Nb37-mEos2. (I and O) The distribution of apparent burst times of (I) Nb80-mEos2 and (O) Nb37-mEos2 nanoclusters. |