
|
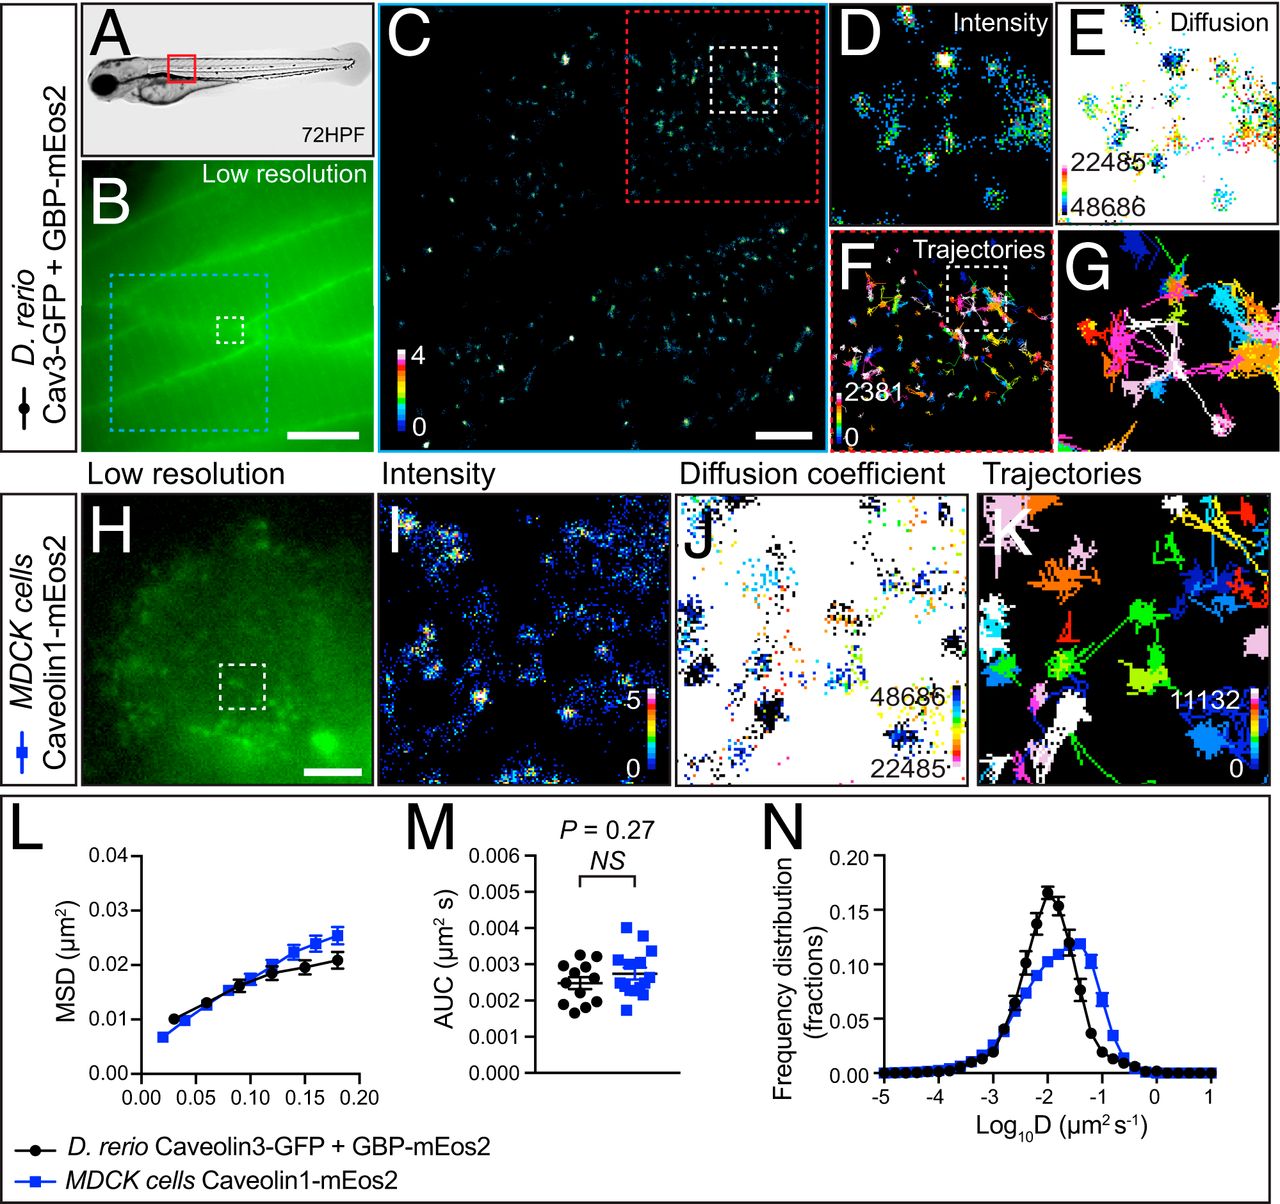
Fig. 2 Single-particle detection of Cav3-GFP in zebrafish by GBP-mEos2 using the FiLM technique. (A) Representative image of a 72-hpf zebrafish embryo. (B) Low-resolution image of the green fluorescence observed within skeletal muscle fibers of a zebrafish expressing Cav3-GFP as well as GBP-mEos2 at the location indicated by the red box in A. (Scale bar, 10μm). Superresolution imaging was performed at 33 Hz with analysis of movies generating (C and D) an average intensity map, (E) a diffusion coefficient map (darker colors represent lower mobility), and (F) a trajectory map (color coded by time; warmer colors acquired later into the acquisition). (Scale bar, C, 2.5 μm). (G) Illustrates the dual confinement trajectories within the region of interest in F. Red box (8 μm × 8 μm). (H) Low-resolution image of mEos2-Cav1 in transfected MDCK cells prior to photoconversion with a 405-nm laser. The region of interest is indicated with a white box (2 μm × 2 μm) in H. Superresolution imaging was performed at 50 Hz and analysis of movies generated (I) average intensity map, (J) diffusion coefficient map, and (K) trajectory map. Analysis of single-particle tracking was expressed as the (L) MSD as a function of time; (M) AUC, and (N) frequency distribution of the diffusion coefficient (n = 12 zebrafish from three independent injections; n = 15 MDCK cells from three independent experiments). Statistics of AUC were performed using an unpaired Student’s t test.