
|
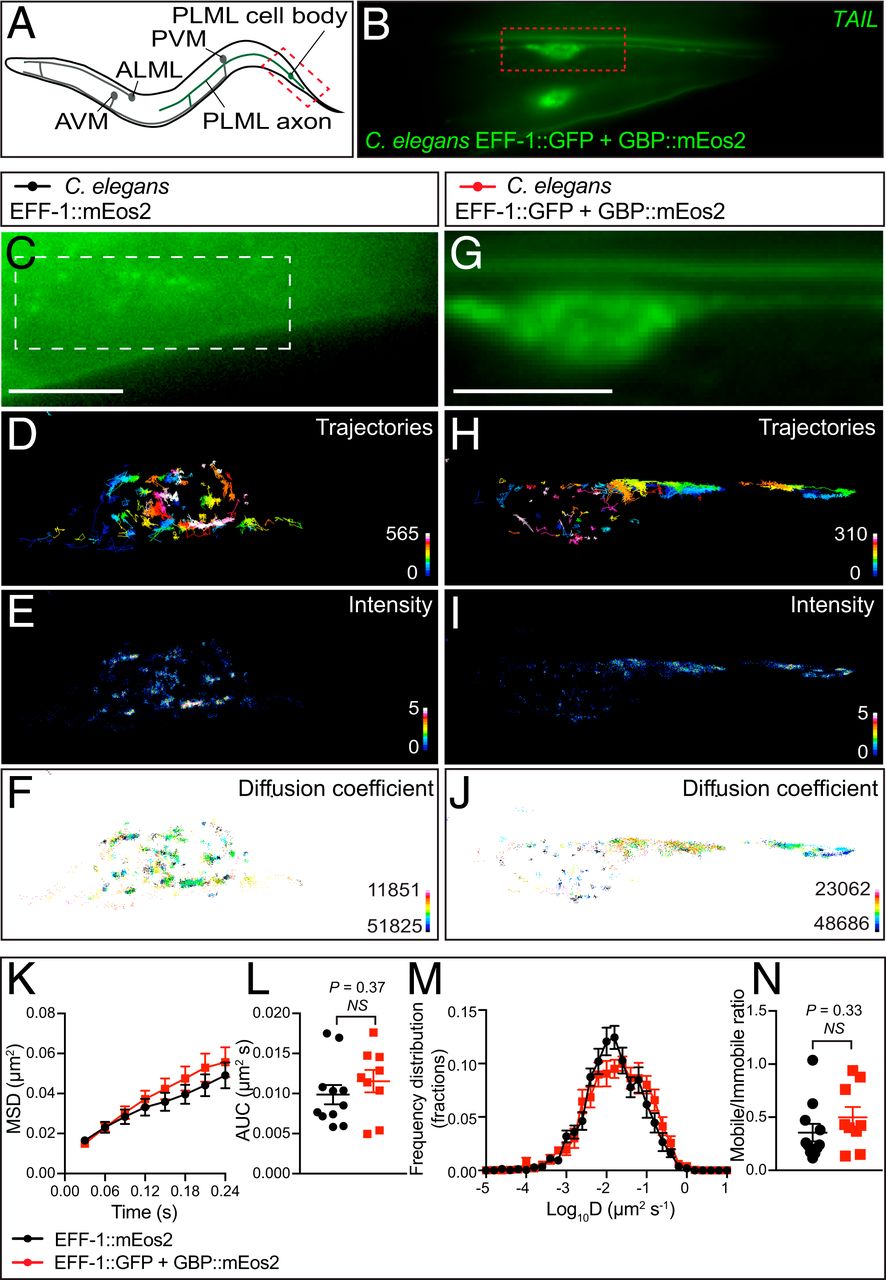
Fig. 3 Single-particle detection of EFF-1::GFP in C. elegans by GBP-mEos2 using the FiLM technique. (A) Illustration showing the location of the mechanosensory neurons in C. elegans driven by Pmec-4 promoter expression. The portion of the PLM mechanosensory neuron imaged in these experiments is delineated by a red box. (B) Low-resolution image of the tail of a representative animal showing both left and right PLM mechanosensory neurons expressing Pmec-4::eff-1::gfp and Pmec-4::mEos2-N1-GBP-Nb. (C) Representative C. elegans PLM mechanosensory neuron in TIRF, expressing Pmec-4::eff-1::Eos2 taken prior to photoconversion with a 405-nm laser. (Scale bar, 5 µm.) Region of interest defined by the white box is used for D–F. Superresolution imaging was performed at 33 Hz and analysis of the movies generated (D) a trajectory map (color coded by time; warmer colors acquired later into the acquisition), (E) an average intensity map, and (F) a diffusion coefficient map (darker colors represent lower mobility). (G) C. elegans expressing Pmec-4::eff-1::gfp and Pmec-4::mEos2-N1-GBP-Nb (Scale bar as in C) (H–J as per D–F). Analysis of single-particle tracking was expressed as the (K) MSD as a function of time, (L) AUC, (M) frequency distribution of the diffusion coefficient, and (N) mobile to immobile ratio (n = 11 and 9, animals for each condition from three independent experiments). Statistics of AUC were performed using an unpaired Student’s t test, and a nonparametric Mann−Whitney U test was used to compare the mobile-to-immobile ratios.