
|
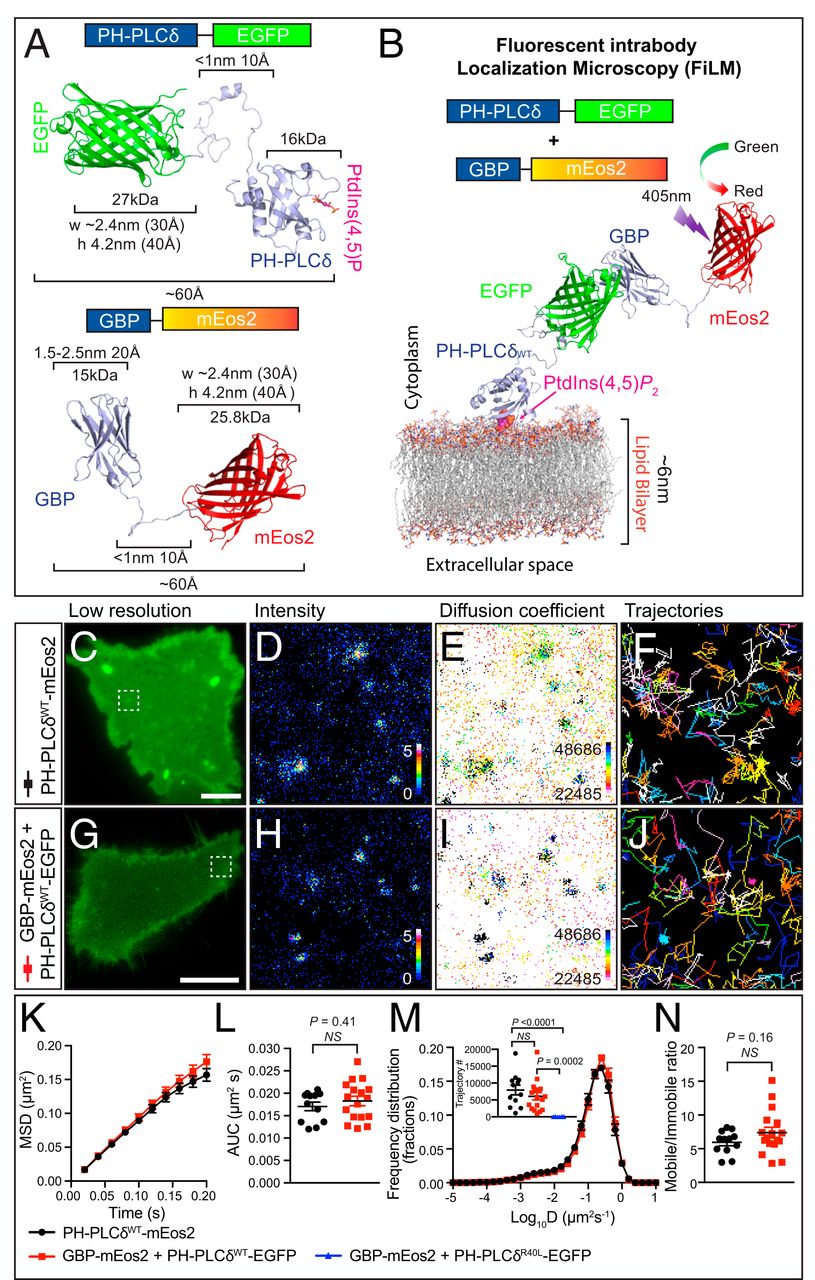
Fig. 1 Single-particle detection of PH-PLCδWT-EGFP by GBP-Nb-mEos2 using the FiLM technique. (A) Expression of PH-PLCδWT-EGFP (GFP target) (Top) together with GBP-mEos2 (Bottom) facilitates single-particle tracking in cellular transfection systems. (B) Illustration of the principle of FiLM using PH-PLCδWT-EGFP target at the plasma membrane. (C) A representative PC12 cell in TIRF shows the green fluorescence of PH-PLCδWT-mEos2 prior to photoconversion. (Scale bar, 5 μm.) (The region of interest, defined by the white box, is used for D–F.) Superresolution imaging was performed at 50 Hz with analysis of movies generating (D) sptPALM average intensity map, (E) diffusion coefficient distribution (darker colors represent lower mobility), and (F) trajectory map (color coded by time; warmer colors acquired later into the acquisition). (G) PC12 cell expressing PH-PLCδWT-EGFP and GBP-mEos2 (H–J as per D–F). (Scale bar, 5 μm.) (K) Analysis of single-particle tracking was expressed as the MSD as a function of time, (L) AUC, (M) frequency distribution of the diffusion coefficient (Inset: trajectory number), and (N) mobile-to-immobile ratio (n = 12 and 17, cells for each condition from three independent experiments, PH-PLCδR40L-EGFP n = 10). Protein structures were generated in PyMOL. Statistics of AUC and mobile-to-immobile ratio were performed using an unpaired Student’s t test. The differences between the two conditions were all nonsignificant (NS). Nonparametric ANOVA Kruskal−Wallis test with Dunn’s multiple comparisons test was used to compare trajectory numbers between the three conditions.