
|
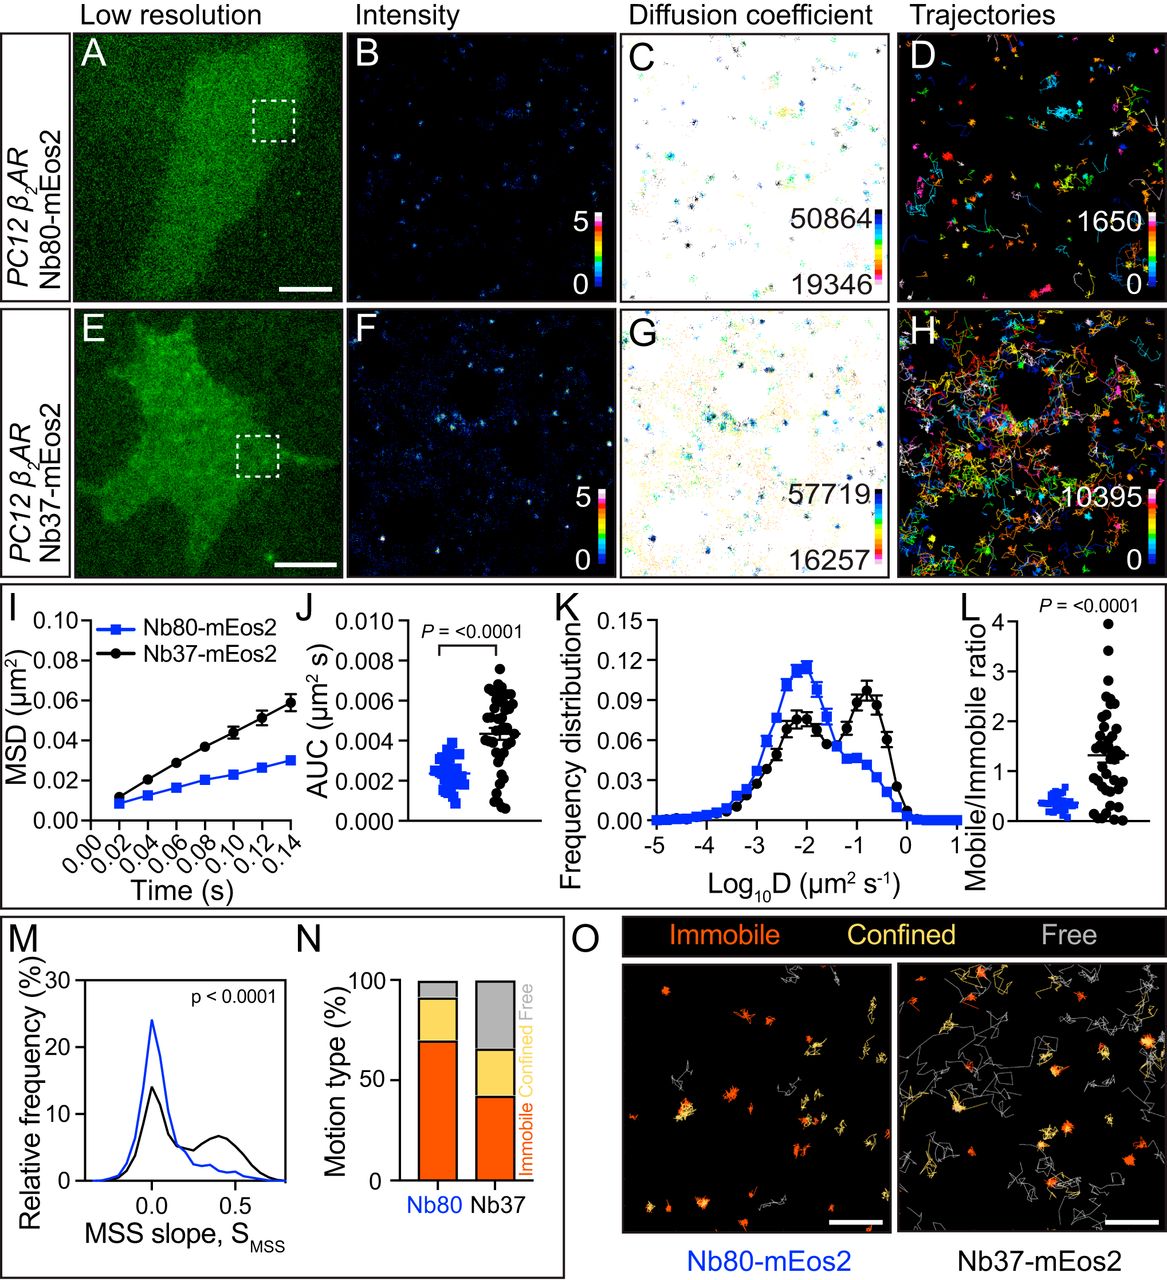
Fig. 8 Single-particle detection of Nb80-mEos2 and Nb37-mEos2 in PC12 cells using the FiLM technique. (A) Representative PC12 cell, in TIRF, of the green fluorescent Nb80-mEos2 intrabody that targets the active conformation of β2-AR taken prior to photoconversion with a 405-nm laser. (Scale bar, 5 μm.) The region of interest is defined by the white box in A Superresolution imaging was performed at 50 Hz, and analysis of movies generated (B) average intensity map, (C) diffusion coefficient map distribution (darker colors represent lower mobility), and (D) trajectory map (color coded by time; warmer colors acquired later into the acquisition). (E) PC12 cell expressing Nb37-mEos2 (E–H as per A–D). Analysis of single-particle tracking was expressed as the (I) MSD as a function of time, (J) AUC, (K) frequency distribution of the diffusion coefficient, and (L) mobile-to-immobile ratio (N = 31 and 41 cells for Nb80 and Nb37, respectively). Statistics of AUC and mobile-to-immobile ratio were performed using a Student’s t test. (M) Distribution of the moment scaling slope of trajectories (n = 6,291 Nb80-mEos2 trajectories from 31 cells and 17,841 Nb37-mEos2 trajectories from 41 cells). (N) Percentage of immobile, confined, and free motion type identified using MSS. (O) Trajectories annotated based on different motion types. (Scale bar, Nb80, 1 μm; Nb37, 0.7 μm.)