
Fig. 4
- ID
- ZDB-FIG-210323-29
- Publication
- Gormal et al., 2020 - Modular transient nanoclustering of activated β2-adrenergic receptors revealed by single-molecule tracking of conformation-specific nanobodies
- Other Figures
- All Figure Page
- Back to All Figure Page
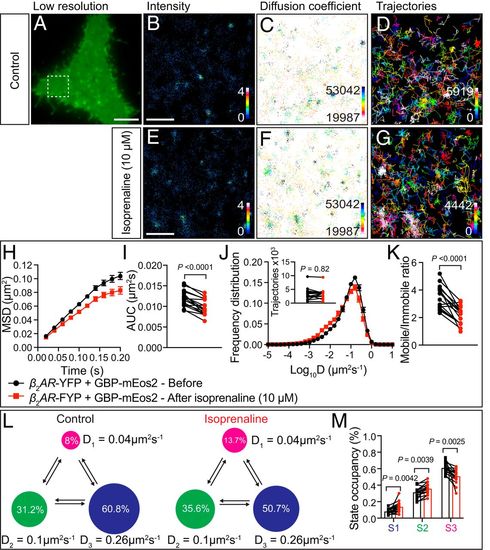
Single-particle detection of β2-AR-YFP by GBP-mEos2 using the FiLM technique before and after isoprenaline addition. (A) A representative PC12 cell in TIRF shows the green fluorescence of β2-AR-YFP and GBP-mEos2 prior to photoconversion. (Scale bar, 5 μm.) (The region of interest, defined by the white box, is used for B and D).) Superresolution imaging was performed at 50 Hz and analysis of the movies generating (B) average intensity map; (C) diffusion coefficient distribution (darker colors represent lower mobility) and (D) trajectory map (color coded by time; warmer colors acquired later into the acquisition). (Scale bar, 1 μm.) (E–G) The region of interest of cell above following isoprenaline treatment (10 µM) (E–G as per B–D). (H) Analysis of single-particle tracking was expressed as the MSD as a function of time, (I) AUC, (J) frequency distribution of the diffusion coefficient (Inset: trajectory number); (K) mobile-to-immobile ratios (n = 16, from three independent experiments). (L and M) Hidden Markov modeling to infer mobility parameters of β2-AR-YFP trajectories. (L) A three-state model with the inferred apparent diffusion coefficients and state occupancies are represented. Each state is illustrated by a colored circle (state 1, immobile, magenta; state 2, intermediate, green; state 3, fast mobile, blue), with the area proportional to the state occupancy. (M) Comparison of state occupancies inferred from β2-AR-YFP trajectories (n = 16 sets, 16 cells from three independent experiments). Statistics of the AUC, mobile-to-immobile ratio, and state occupancy were performed using a paired Student’s t test, and trajectory number comparison was made using paired nonparametric Wilcox test. |