
- Title
-
Chemical effects on dye efflux activity in live zebrafish embryos and on zebrafish Abcb4 ATPase activity
- Authors
- Bieczynski, F., Burkhardt-Medicke, K., Marcelo Luquet, C., Scholz, S., Luckenbach, T.
- Source
- Full text @ FEBS Lett.
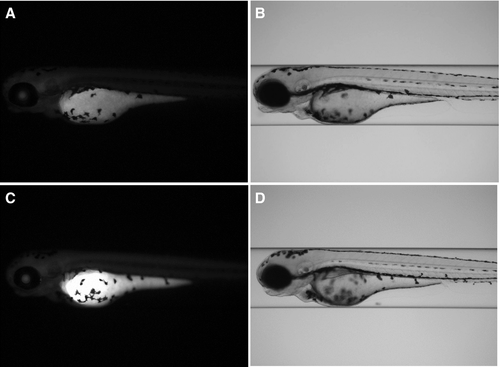
Fluorescence (A, C) and bright‐field (B, D) images of live zebrafish embryos upon exposure to rhodamine B at 1 µm for 2 h. For imaging, the embryos were automatically positioned in lateral orientation in glass capillaries using the VAST system. (A, B) Solvent control (0.1% DMSO); (C, D) cyclosporin A (40 µm) treatment. |
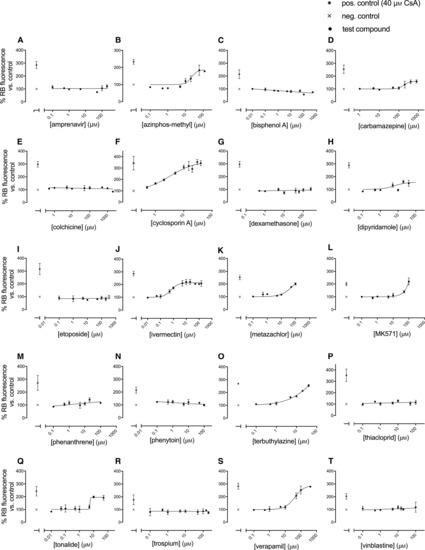
(A–T) Fluorescence levels in zebrafish embryos upon incubation to 1 µm rhodamine B along with chemicals at different concentrations for 2 h. The percentage fluorescence relative to the respective control (0.1% DMSO) was plotted vs. chemical concentration. Symbols and bars represent means ± SE. Data points are from 2 to 6 replicates; each replicate is the mean fluorescence measured in eight embryos exposed and measured on the same day. Cyclosporin A (40 µm) was tested in each experimental series as positive control; exposures with rhodamine B along with 0.1% DMSO served as negative controls. Data were fitted with linear or nonlinear regression (HILL model, Eqn 1). For regression parameters, refer to Table 2. |
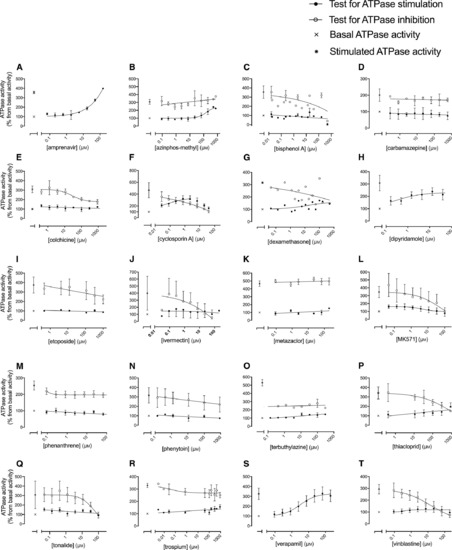
(A–T) ATPase activities of recombinant zebrafish Abcb4 protein in the presence of chemicals at different concentrations. The percentage ATPase activity relative to the respective control (2% DMSO) was plotted vs. chemical concentration. Symbols and bars represent means ± SE from 1 to 5 replicates. All compounds were tested for stimulation of the basal Abcb4 ATPase activity; most compounds were also tested for inhibition of the Abcb4 ATPase activity stimulated with 40 or 50 µm verapamil. Verapamil (40 or 50 µm) was tested in each experimental series as positive control (stimulated activity; sA); reactions with 2% DMSO served as negative controls (basal activity; bA). Data were fitted with nonlinear (HILL model, Eqn 1) or linear regression. For regression parameters, refer to Table 2. |
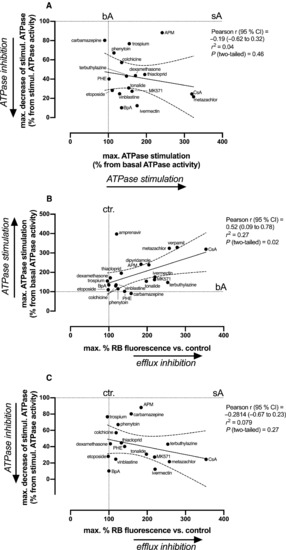
(A–C) Correlations of the maximum measured effect levels for each compound in the different tests: (A) maximum inhibition of stimulated Abcb4 ATPase activity vs. the maximum stimulation of the basal Abcb4 ATPase activity; (B) maximum stimulation of the basal Abcb4 ATPase activity vs. the maximum observed increase in fluorescence in the dye efflux assay; and (C) maximum inhibition of stimulated Abcb4 ATPase activity vs. the maximum observed increase in fluorescence in the dye efflux assay. Each compound is represented by a data point. Pearson’s correlation parameters are shown in the respective graphs. Linear regressions are with 95% confidence intervals. APM, azinphos‐methyl; bA, basal ATPase activity; BpA, bisphenol A; CsA, cyclosporin A; ctrl, control; PHE, phenanthrene; sA, stimulated ATPase activity. Equations for linear regressions are as follows: (a) y = −0.06692x + 53.66; (b) y = 0.6272x + 82.25; and (c) y = 0.09262x + 58.07. |