
Fig. 3
- ID
- ZDB-IMAGE-210426-18
- Publication
- Bieczynski et al., 2020 - Chemical effects on dye efflux activity in live zebrafish embryos and on zebrafish Abcb4 ATPase activity
- All Figures
- Figures for Bieczynski et al., 2020
|
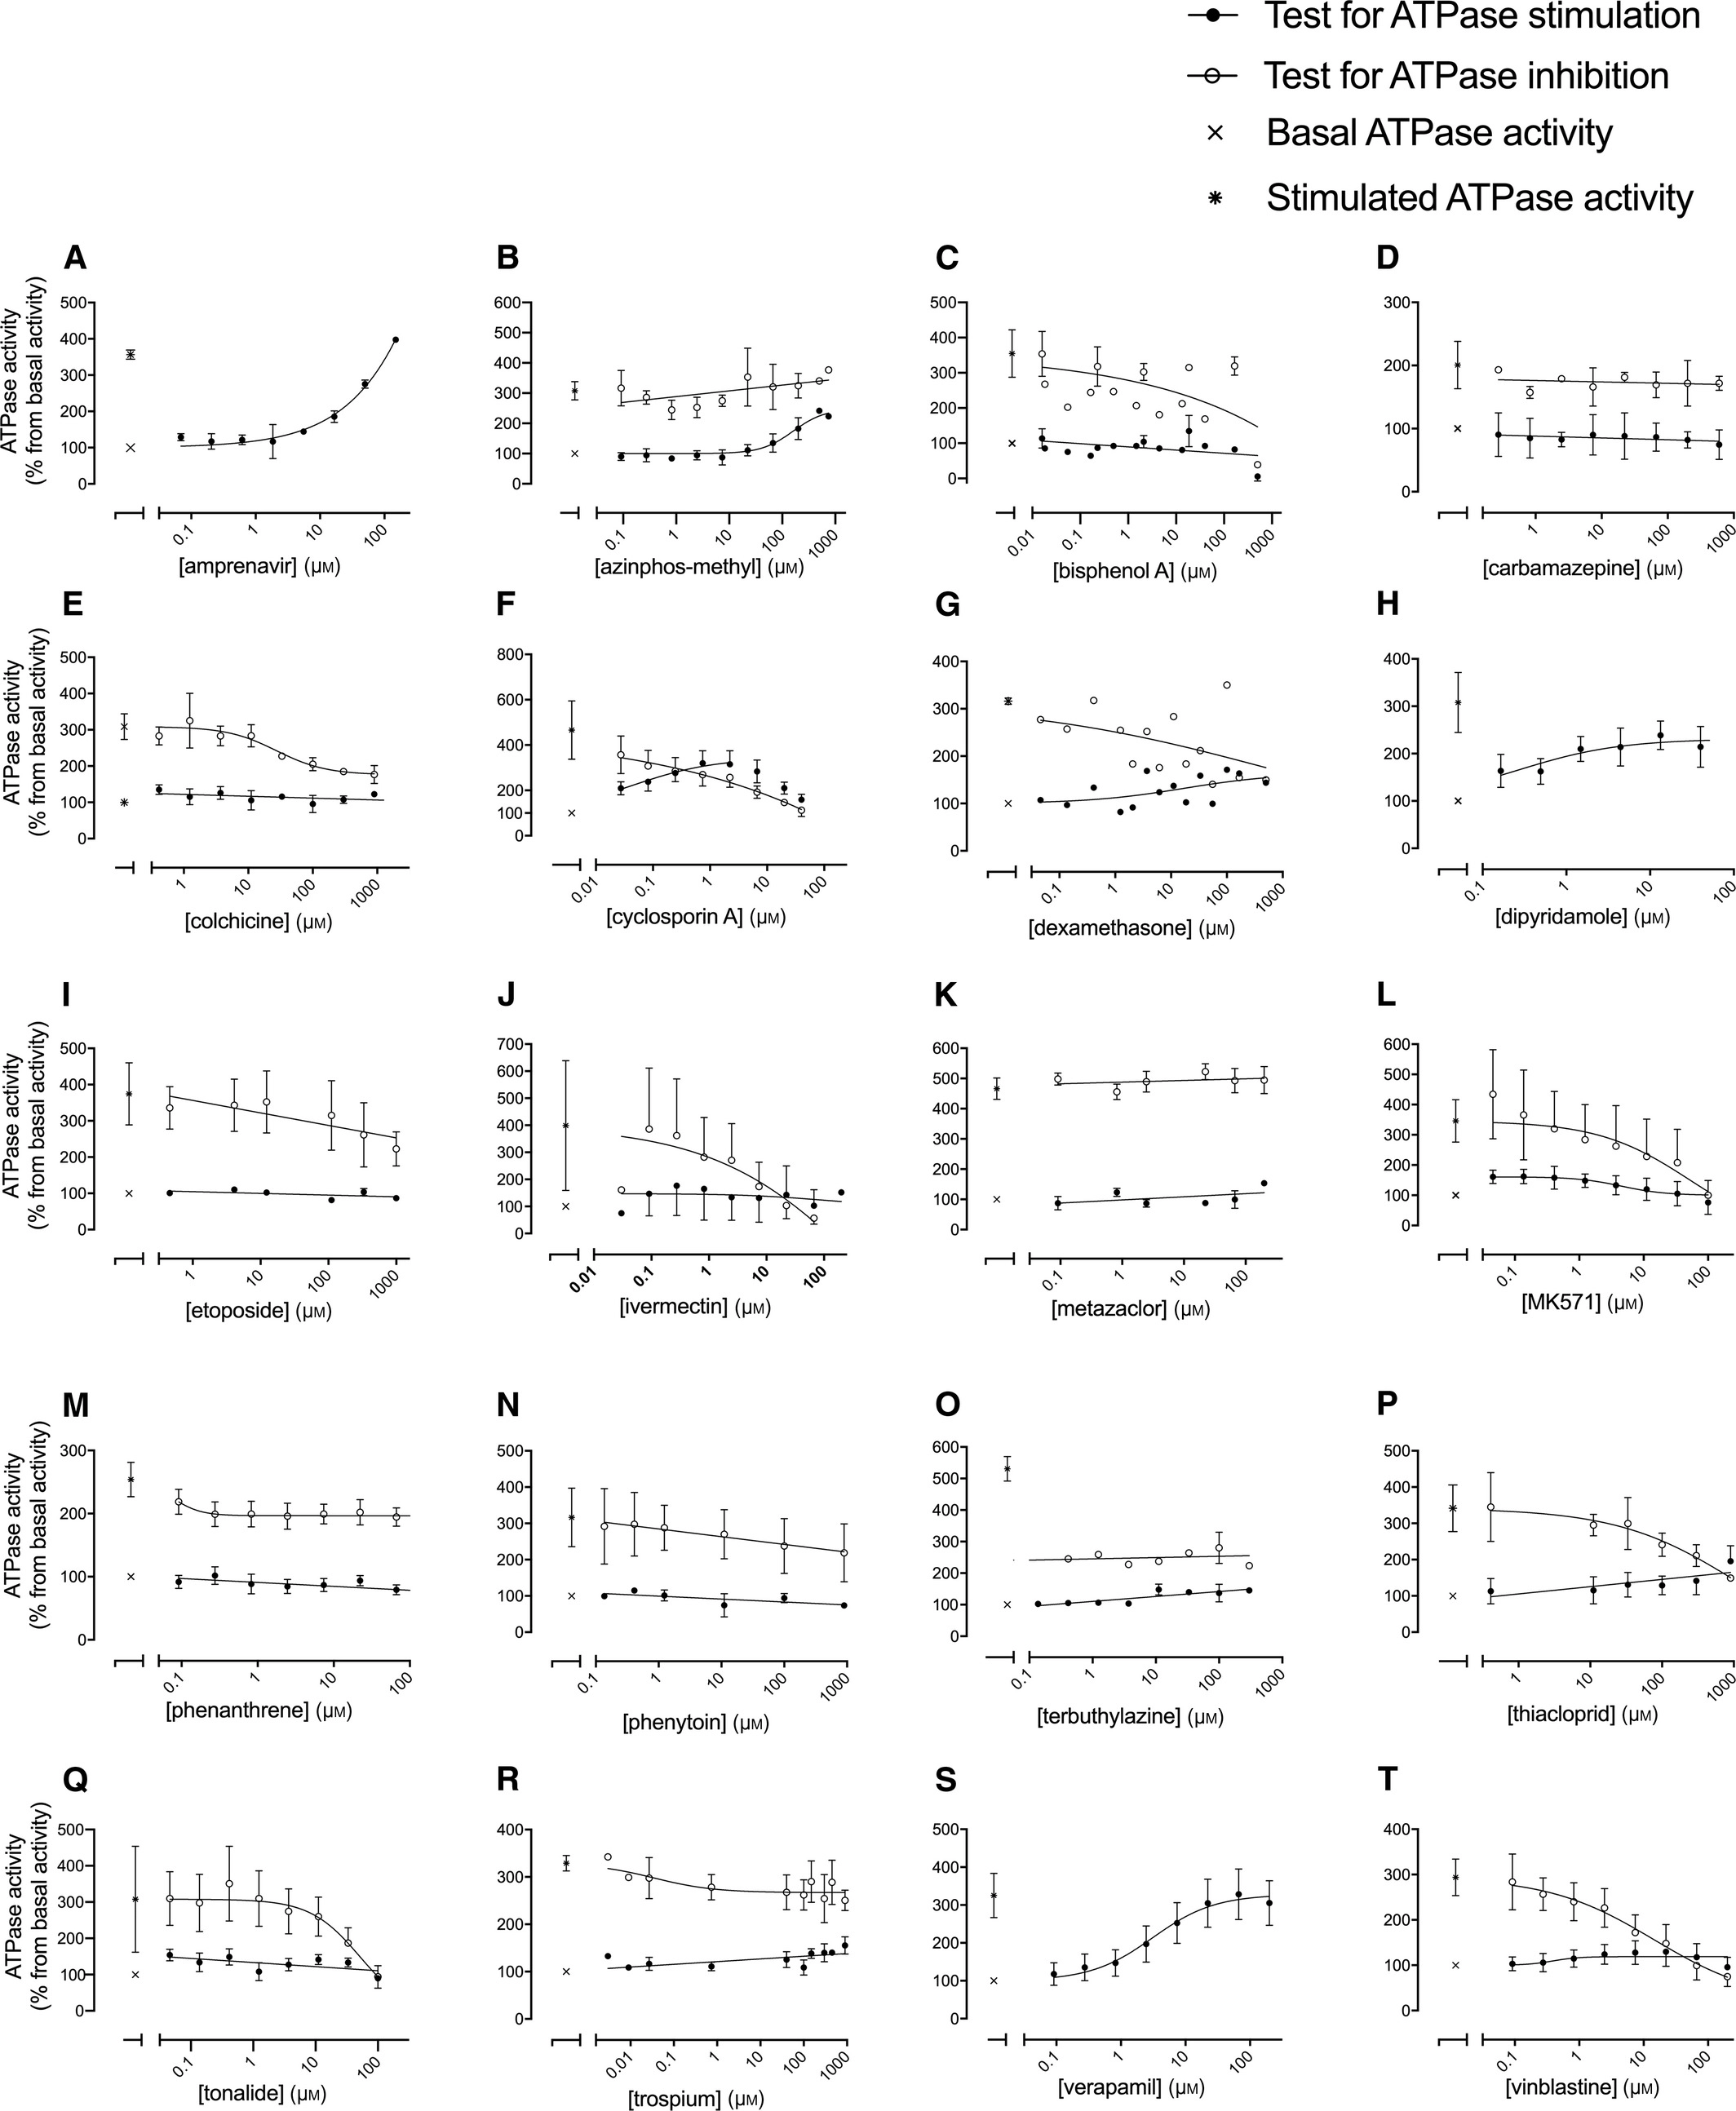
Fig. 3 (A–T) ATPase activities of recombinant zebrafish Abcb4 protein in the presence of chemicals at different concentrations. The percentage ATPase activity relative to the respective control (2% DMSO) was plotted vs. chemical concentration. Symbols and bars represent means ± SE from 1 to 5 replicates. All compounds were tested for stimulation of the basal Abcb4 ATPase activity; most compounds were also tested for inhibition of the Abcb4 ATPase activity stimulated with 40 or 50 µm verapamil. Verapamil (40 or 50 µm) was tested in each experimental series as positive control (stimulated activity; sA); reactions with 2% DMSO served as negative controls (basal activity; bA). Data were fitted with nonlinear (HILL model, Eqn 1) or linear regression. For regression parameters, refer to Table 2.