
Fig. 2
- ID
- ZDB-FIG-210426-17
- Publication
- Bieczynski et al., 2020 - Chemical effects on dye efflux activity in live zebrafish embryos and on zebrafish Abcb4 ATPase activity
- Other Figures
- All Figure Page
- Back to All Figure Page
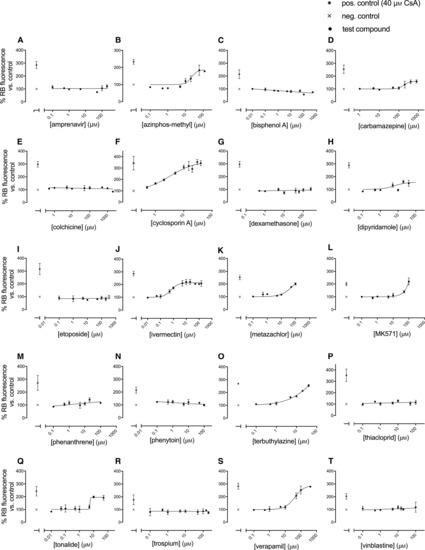
(A–T) Fluorescence levels in zebrafish embryos upon incubation to 1 µm rhodamine B along with chemicals at different concentrations for 2 h. The percentage fluorescence relative to the respective control (0.1% DMSO) was plotted vs. chemical concentration. Symbols and bars represent means ± SE. Data points are from 2 to 6 replicates; each replicate is the mean fluorescence measured in eight embryos exposed and measured on the same day. Cyclosporin A (40 µm) was tested in each experimental series as positive control; exposures with rhodamine B along with 0.1% DMSO served as negative controls. Data were fitted with linear or nonlinear regression (HILL model, Eqn 1). For regression parameters, refer to Table 2. |