
- Title
-
Toxicity of different zinc oxide nanomaterials and dose-dependent onset and development of Parkinson's disease-like symptoms induced by zinc oxide nanorods
- Authors
- Jin, M., Li, N., Sheng, W., Ji, X., Liang, X., Kong, B., Yin, P., Li, Y., Zhang, X., Liu, K.
- Source
- Full text @ Environ. Int.

Fig. 1. Characterization of three ZnO nanomaterials with different shape/size. SEM images overview of ZnO NPs (A-i), s-ZnO NRs (B-i), and l-ZnO NRs (C-i), where the insets are magnified SEM images of corresponding products (D: diameter; L: length). The magnified TEM images of ZnO NPs (A-ii), s-ZnO NRs (B-ii), and l-ZnO NRs (C-ii), the insets of which are SAED patterns of selected areas that marked by the red rectangles, respectively. HRTEM images of the red squared area of ZnO NPs (A-iii), s-ZnO NRs (B-iii), and l-ZnO NRs (C-iii) in A-ii, B-ii, and C-ii, respectively. PXRD patterns of ZnO NPs (A-iv), s-ZnO NRs (B-iv), and l-ZnO NRs (C-iv). Zn 2p (A-v, B-v, C-v) and O 1 s (A-vi, B-vi, C-vi) XPS spectra of ZnO NPs (A-v, vi), s-ZnO NRs (B-v, vi), and l-ZnO NRs (C-v, vi). (For interpretation of the references to colour in this figure legend, the reader is referred to the web version of this article.) |
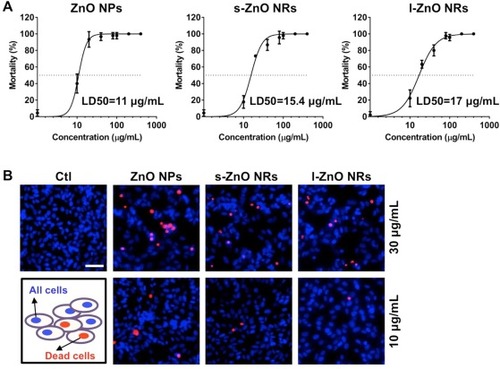
Fig. 2. Toxicity comparison of three ZnO nanomaterials using zebrafish and SH-SY5Y cells. (A) The LD50 of ZnO NPs, s-ZnO NRs, and l-ZnO NRs in zebrafish larvae treated with ZnO nanomaterials at various doses (10, 20, 40, 80, 100, 200, 400 μg/mL), respectively. (B) Representative fluorescent images of PI (red) and Hoechst 33,342 (blue) staining of SH-SY5Y cells incubated with ZnO NPs, s-ZnO NRs, and l-ZnO NRs at 10 and 30 μg/mL for 24 h, respectively. Scale bar, 50 μm. (For interpretation of the references to colour in this figure legend, the reader is referred to the web version of this article.) |
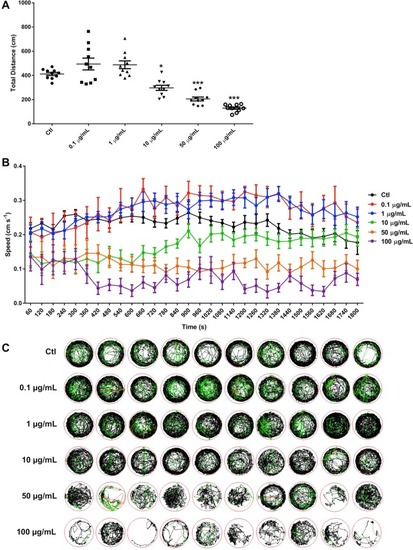
Fig. 3. Inhibitory effects of l-ZnO NRs on locomotor capacity of zebrafish. (A) The total distance traveled of zebrafish exposed to l-ZnO NRs at 144 hpf. The distance moved for each larva from each group was analyzed using Zeblab software. n = 10 per group. *P < 0.05, ***P < 0.001 vs the control. (B) The average speed of the larval zebrafish from different groups. (C) The digital tracks map. The red lines are associated with fast movement; green lines are linked to medium movement; black lines indicate slow movement. n = 10 per group. (For interpretation of the references to colour in this figure legend, the reader is referred to the web version of this article.) |

Fig. 4. Transcript levels of key neurodevelopmental and PD-related genes in l-ZnO NRs-treated zebrafish. Transcription levels of neurodevelopmental genes including gfap (A), c-fos (B), gap43 (C), tuba1b (D), and syn2a (E) and expression levels of PD-related genes comprising α-syn (F), uch-l1 (G), pink1 (H), and parkin (I) were measured by qPCR. *P < 0.05, **P < 0.01, ***P < 0.001 vs the control. |
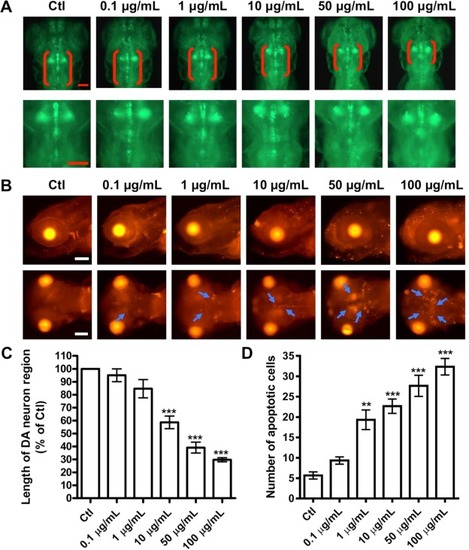
Fig. 5. l-ZnO NRs-induced DA neuronal loss and apoptosis in zebrafish brain. (A) Representative microscopy images of 144 hpf transgenic zebrafish vmat2:GFP treated with different doses of l-ZnO NRs. DA neurons were indicated by red brackets. Enlarged images were shown to improve visualization of morphology of DA neurons. Scale bar, 100 μm. (B) After exposure to l-ZnO NRs for 144 h, the larval zebrafish were assayed by TUNEL. Representative lateral and ventral views of the zebrafish head. The areas of apoptotic cells were indicated by blue arrows. Scale bar, 100 μm. Statistical analysis of (C) the length of DA neuron region and (D) the number of apoptotic cells in the brain area of zebrafish larvae treated with l-ZnO NRs. **P < 0.01, ***P < 0.001 vs the control. (For interpretation of the references to colour in this figure legend, the reader is referred to the web version of this article.) |