
Fig. 3
- ID
- ZDB-IMAGE-210222-46
- Publication
- Jin et al., 2020 - Toxicity of different zinc oxide nanomaterials and dose-dependent onset and development of Parkinson's disease-like symptoms induced by zinc oxide nanorods
- All Figures
- Figures for Jin et al., 2020
|
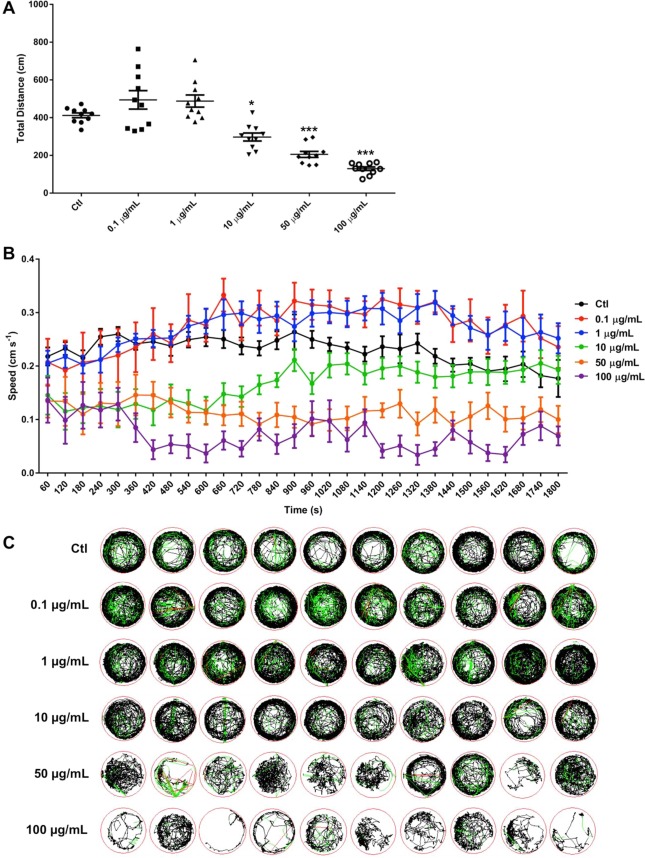
Fig. 3 Fig. 3. Inhibitory effects of l-ZnO NRs on locomotor capacity of zebrafish. (A) The total distance traveled of zebrafish exposed to l-ZnO NRs at 144 hpf. The distance moved for each larva from each group was analyzed using Zeblab software. n = 10 per group. *P < 0.05, ***P < 0.001 vs the control. (B) The average speed of the larval zebrafish from different groups. (C) The digital tracks map. The red lines are associated with fast movement; green lines are linked to medium movement; black lines indicate slow movement. n = 10 per group. (For interpretation of the references to colour in this figure legend, the reader is referred to the web version of this article.)