
IMAGE
Fig. 4
- ID
- ZDB-IMAGE-210222-47
- Publication
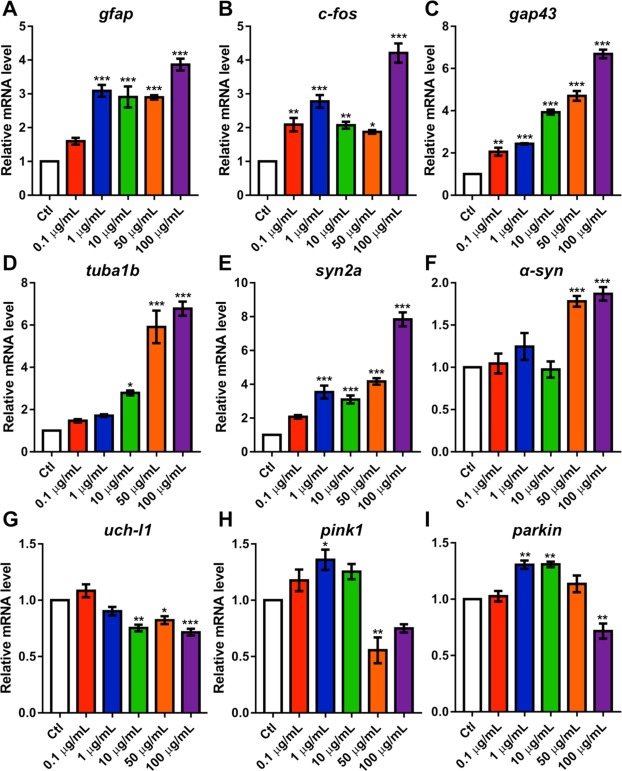
- Jin et al., 2020 - Toxicity of different zinc oxide nanomaterials and dose-dependent onset and development of Parkinson's disease-like symptoms induced by zinc oxide nanorods
- All Figures
- Figures for Jin et al., 2020
Image
|
Figure Caption
Fig. 4 Fig. 4. Transcript levels of key neurodevelopmental and PD-related genes in l-ZnO NRs-treated zebrafish. Transcription levels of neurodevelopmental genes including gfap (A), c-fos (B), gap43 (C), tuba1b (D), and syn2a (E) and expression levels of PD-related genes comprising α-syn (F), uch-l1 (G), pink1 (H), and parkin (I) were measured by qPCR. *P < 0.05, **P < 0.01, ***P < 0.001 vs the control.
Acknowledgments
This image is the copyrighted work of the attributed author or publisher, and
ZFIN has permission only to display this image to its users.
Additional permissions should be obtained from the applicable author or publisher of the image.
Full text @ Environ. Int.