
Fig. 2
- ID
- ZDB-IMAGE-210222-45
- Publication
- Jin et al., 2020 - Toxicity of different zinc oxide nanomaterials and dose-dependent onset and development of Parkinson's disease-like symptoms induced by zinc oxide nanorods
- All Figures
- Figures for Jin et al., 2020
|
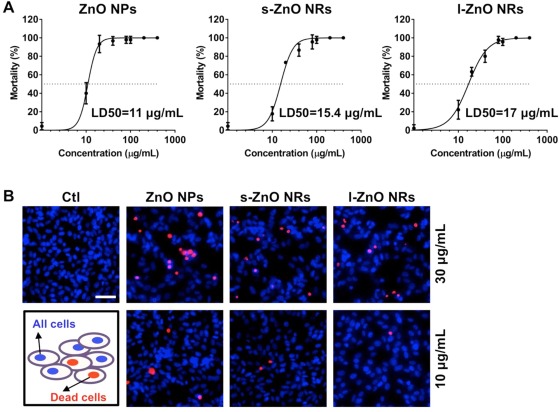
Fig. 2 Fig. 2. Toxicity comparison of three ZnO nanomaterials using zebrafish and SH-SY5Y cells. (A) The LD50 of ZnO NPs, s-ZnO NRs, and l-ZnO NRs in zebrafish larvae treated with ZnO nanomaterials at various doses (10, 20, 40, 80, 100, 200, 400 μg/mL), respectively. (B) Representative fluorescent images of PI (red) and Hoechst 33,342 (blue) staining of SH-SY5Y cells incubated with ZnO NPs, s-ZnO NRs, and l-ZnO NRs at 10 and 30 μg/mL for 24 h, respectively. Scale bar, 50 μm. (For interpretation of the references to colour in this figure legend, the reader is referred to the web version of this article.)