
Fig. 1
- ID
- ZDB-IMAGE-210222-44
- Publication
- Jin et al., 2020 - Toxicity of different zinc oxide nanomaterials and dose-dependent onset and development of Parkinson's disease-like symptoms induced by zinc oxide nanorods
- All Figures
- Figures for Jin et al., 2020
|
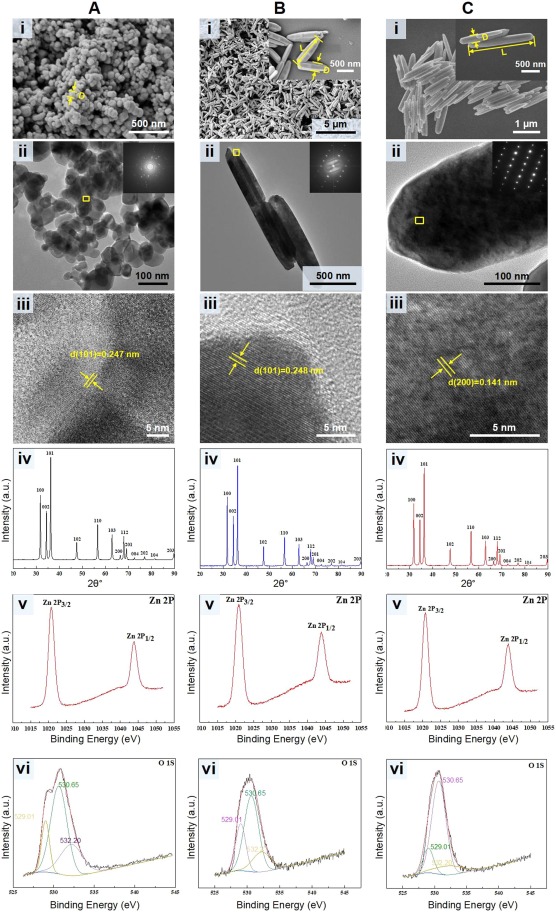
Fig. 1 Fig. 1. Characterization of three ZnO nanomaterials with different shape/size. SEM images overview of ZnO NPs (A-i), s-ZnO NRs (B-i), and l-ZnO NRs (C-i), where the insets are magnified SEM images of corresponding products (D: diameter; L: length). The magnified TEM images of ZnO NPs (A-ii), s-ZnO NRs (B-ii), and l-ZnO NRs (C-ii), the insets of which are SAED patterns of selected areas that marked by the red rectangles, respectively. HRTEM images of the red squared area of ZnO NPs (A-iii), s-ZnO NRs (B-iii), and l-ZnO NRs (C-iii) in A-ii, B-ii, and C-ii, respectively. PXRD patterns of ZnO NPs (A-iv), s-ZnO NRs (B-iv), and l-ZnO NRs (C-iv). Zn 2p (A-v, B-v, C-v) and O 1 s (A-vi, B-vi, C-vi) XPS spectra of ZnO NPs (A-v, vi), s-ZnO NRs (B-v, vi), and l-ZnO NRs (C-v, vi). (For interpretation of the references to colour in this figure legend, the reader is referred to the web version of this article.)