
Fig. 5
- ID
- ZDB-IMAGE-210222-48
- Publication
- Jin et al., 2020 - Toxicity of different zinc oxide nanomaterials and dose-dependent onset and development of Parkinson's disease-like symptoms induced by zinc oxide nanorods
- All Figures
- Figures for Jin et al., 2020
|
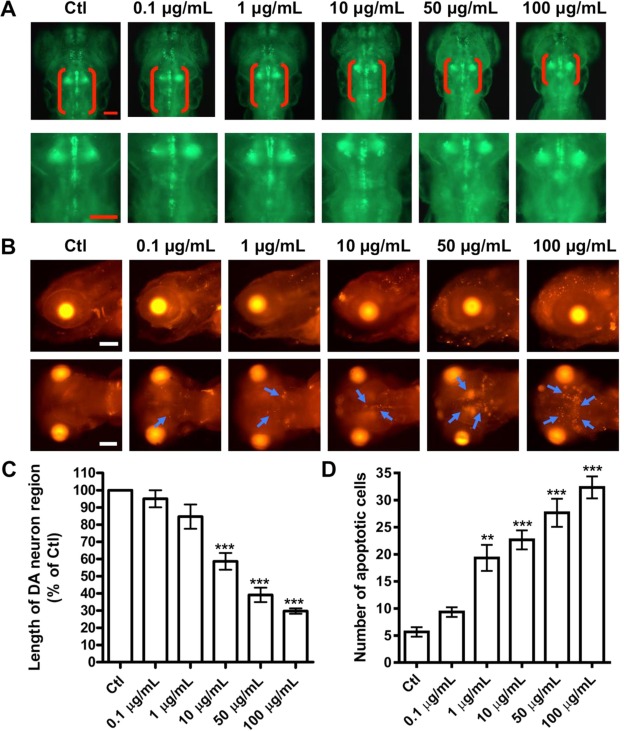
Fig. 5 Fig. 5. l-ZnO NRs-induced DA neuronal loss and apoptosis in zebrafish brain. (A) Representative microscopy images of 144 hpf transgenic zebrafish vmat2:GFP treated with different doses of l-ZnO NRs. DA neurons were indicated by red brackets. Enlarged images were shown to improve visualization of morphology of DA neurons. Scale bar, 100 μm. (B) After exposure to l-ZnO NRs for 144 h, the larval zebrafish were assayed by TUNEL. Representative lateral and ventral views of the zebrafish head. The areas of apoptotic cells were indicated by blue arrows. Scale bar, 100 μm. Statistical analysis of (C) the length of DA neuron region and (D) the number of apoptotic cells in the brain area of zebrafish larvae treated with l-ZnO NRs. **P < 0.01, ***P < 0.001 vs the control. (For interpretation of the references to colour in this figure legend, the reader is referred to the web version of this article.)