FIGURE SUMMARY
Title

ndufa7 plays a critical role in cardiac hypertrophy

Authors
Shi, X., Zhang, Y., Chen, R., Gong, Y., Zhang, M., Guan, R., Rotstein, O.D., Liu, X., Wen, X.Y.
Source
Full text @ J. Cell. Mol. Med.

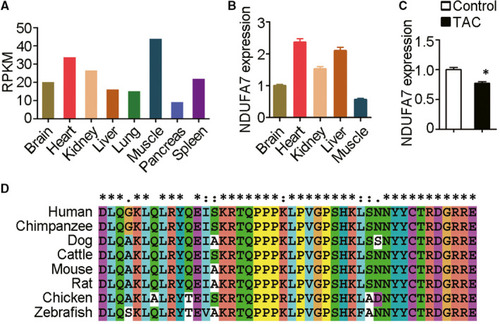
NDUFA7 is involved in cardiac hypertrophy induced by ISO infusion. (A) Tissue expression profiles of NDUFA7 are generated from GTEx database (
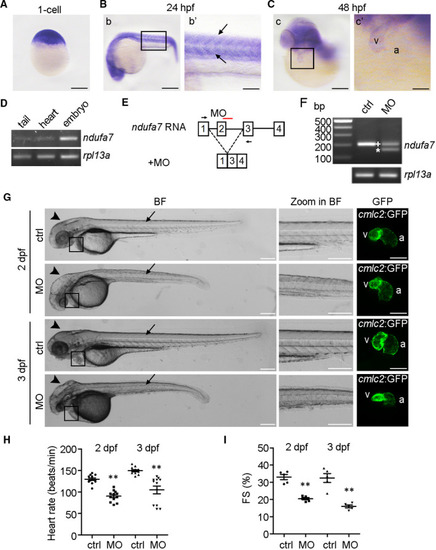
https://commonfund.nih.gov/gtex). Median RPKM level was shown. (B) RNA was extracted from different tissues of mice, and RT‐qPCR analysis of NDUFA7 and GAPDH expression was then performed. (C) NDUFA7 expression in hearts of mice subjected to cardiac pressure overload by transverse aortic constriction (TAC) or in control group (GSE2459). *P < .05 compared with healthy control. (D) Similarity of Ndufa7 protein sequence from different species including human, chimpanzee, dog, cattle, mouse, rat, chicken and zebrafish

Knockdown of ndufa7 results in cardiac defect in developing zebrafish embryos. (A‐C) Representative images of whole‐mount in situ hybridization using the ndufa7 riboprobe were showed. The experiments were performed in triplicate, with 20 embryos per developmental stage. (A) Zebrafish ndufa7 transcript is broadly expressed at 1‐cell stage. Scale bar, 250 μm. (B) At 24 hpf, ndufa7 is expressed in the somite (box in b, and arrow in b’). Scale bar, 250 μm in b, 100 μm in b’. (C) By 48 hpf, ndufa7 is enriched in the heart (box in c), v represents ventricle, and a represents atrium. Scale bar, 250 μm in c, 100 μm in c’. (D) RT‐PCR of ndufa7 and rpl13a RNA isolated from 2 dpf cmlc2::GFP zebrafish whole embryo, tail and heart. (E) The ndufa7 splice morpholino target site and the aberrant transcript. (F) RT‐PCR amplification of RNA from control MO and ndufa7 MO‐injected zebrafish showing altered splicing of ndufa7 with either the integration of exon 2 (+) or the partial skipping of exon 2 (*). (G) Morphological defects observed in ndufa7 morphants (MO) or controls (ctrl) at 2 dpf and 3 dpf. Arrows and arrowheads showed the defects in somites and head, respectively. The fluorescent image demonstrated heart phenotype from the enlarged box region. Scale bar, 300 μm in bright field (BF) and zoom in BF, 150 μm in GFP field. V represents ventricle, and a represents atrium. The experiments were performed in triplicate, processing 40 embryos per condition. (H) WT embryos were injected with MOs at 1‐cell stage, and heart rate was counted via a recorded video captured with the aid of a microscope. Statistical test: Student's t test. **P < .01 compared with controls. n = 12 measurements per condition. (I) Fractional shortening (FS) of the ventricular chamber in control and ndufa7 morphants was measured at the indicated developmental stages. Statistical test: Student's t test. *P < .05 compared with controls. n = 5 measurements per condition

EXPRESSION / LABELING:
Gene:
Fish:
Anatomical Terms:
Stage Range: 1-cell to Long-pec
PHENOTYPE:
Fish:
Knockdown Reagent:
Observed In:
Stage Range: Prim-5 to Long-pec

ndufa7 inhibition contributes to cardiac structural defects. (A) Wild‐type zebrafish embryos were injected with ndufa7 MO or control MO at 1‐cell stage and then subjected to whole‐mount ISH with riboprobes against vmhc at 3 dpf. Lateral views of endogenous vmhc mRNA expression pattern were visualized under the microscope (a, b). The expression pattern of vmhc mRNA transcripts was expressed in the trunk muscle (a’, b’), as well as in the ventricle under the dorsal views (a’’, b’’). Arrows and arrowheads indicate the muscle structure and outflow track, respectively, and v represents ventricle. Scale bar, 75 μm. The experiments were performed in triplicate, with 20 individuals per condition. (B) Experiments were performed as in (A), and the staining area of vmhc in the heart was examined using ImageJ software. Statistical test: Student's t test. **P < .01 compared with control MO group, n = 6 measurements per condition. (C) cmlc2::GFP embryos were injected with ndufa7 MO or control MO at 1‐cell stage, and RNA was then extracted from harvested embryo hearts at 3 dpf. The expression level of vmhc in the hearts was examined by RT‐qPCR. Statistical test: Student's t test. **P < .01 compared with control MO group, n = 6 measurements per condition. (D) Wild‐type zebrafish embryos were injected with ndufa7 MO or control MO at 1‐cell stage, and then subjected to whole‐mount ISH with riboprobes against cmlc2 at 3 dpf. Dorsal views of endogenous cmlc2 mRNA expression pattern were observed. Arrowheads indicate the outflow track, v represents ventricle and a represents atrium. Scale bar, 75 μm. The experiments were performed in triplicate, with 20 individuals per condition. (E) cmlc2::GFP embryos were injected with ndufa7 MO or control MO at 1‐cell stage, and RNA was then extracted from embryo hearts at 3 dpf for RT‐qPCR. Statistical test: Student's t test. *P < .05 compared with control MO group, n = 6 measurements per condition

EXPRESSION / LABELING:
Genes:
Fish:
Knockdown Reagent:
Anatomical Term:
Stage: Protruding-mouth

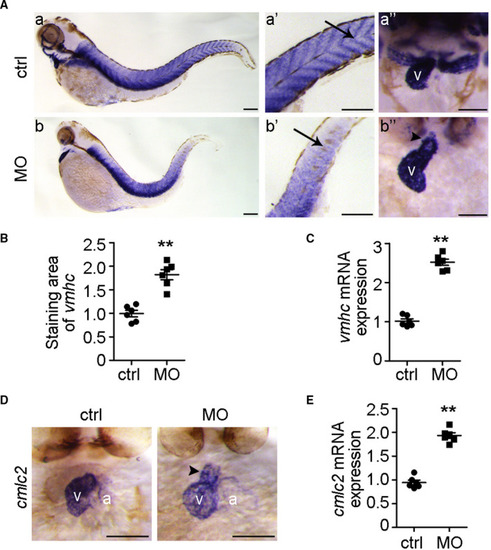
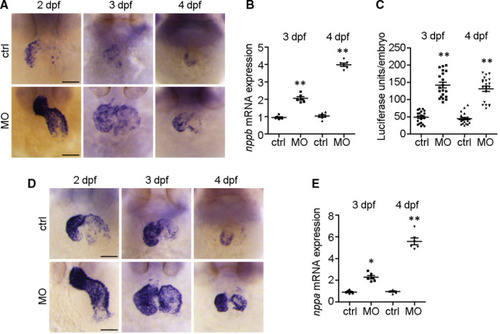
The cardiac hypertrophy biomarkers
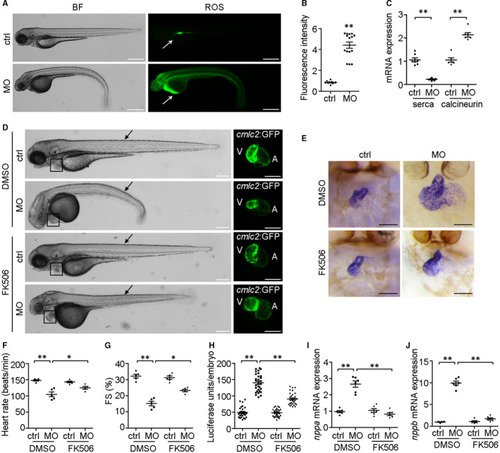
 nppb and nppa are upregulated by ndufa7 depletion. (A) WT zebrafish embryos were injected with ndufa7 MO or control MO and then subjected to whole‐mount in situ hybridization with riboprobes against nppb. Scale bar, 75 μm. The experiments were performed in triplicate, with 20 individuals per condition. (B) cmlc2::GFP embryos were injected with ndufa7 MO or control MO at 1‐cell stage, and RNA was then extracted from harvested embryo hearts at 3 dpf or 4 dpf for RT‐qPCR. The experiments were performed in triplicate, with 60 individuals per condition. Statistical test: Student's t test. **P < .01 compared with control MO group, n = 6 measurements per condition. (C) nppb::F‐luc embryos were injected with ndufa7 splice‐blocking MO or control MO at 1‐cell stage and collected at 3 dpf and 4 dpf for the luciferase assay. The experiments were performed in triplicate, with n = 30 individuals per condition. Statistical test: Student's t test. **P < .01 compared with control MO group, n = 20 measurements per condition. (D) Wild‐type zebrafish embryos were injected with ndufa7 MO or control MO and then subjected to whole‐mount in situ hybridization with riboprobes against nppa probe. Scale bar, 75 μm. The experiments were performed in triplicate, with 20 individuals per condition. (E) cmlc2::GFP embryos were injected with ndufa7 MO or control MO at 1‐cell stage, and RNA was then extracted from harvested embryo hearts at 3 dpf or 4 dpf for RT‐qPCR. The experiments were performed in triplicate, with 60 individuals per condition. Statistical test: Student's t test. **P < .01, *P < .05 compared with control MO group, n = 6 measurements per condition

Calcium signalling is involved in ndufa7‐depletion induced cardiac hypertrophy. (A) WT zebrafish embryos were injected with MO at 1‐cell stage and stained for ROS using 2’,7’‐dichlorofluorescin diacetate. Arrows indicate the ROS staining in the heart. Scale bar, 500 μm. (B) Experiments were performed as in (A), and the intensity of ROS level was analysed. **P < .01 compared with control MO group. (C) cmlc2::GFP embryos were injected with ndufa7 MO or control MO at 1‐cell stage, and RNA was then extracted from harvested embryo hearts at 3 dpf for RT‐qPCR. The expression level of serca and calcineurin were examined. The experiments were performed in triplicate, with 60 individuals per condition. Statistical test: Student's t test. **P < .01 compared with control MO group. (D) MO microinjections were performed at 1‐cell stage, 0.5% DMSO (vehicle control) or FK506 (in 0.5% DMSO) were added to embryo water at 21 hpf and cardiac fluorescent imaging was performed on cmlc2::GFP embryos at 3 dpf. Black arrow indicates somite defects, and black box shows cardiac defects. Scale bar, 300 μm in bright field, 150 μm in GFP field. The experiments were performed in triplicate, processing 30 embryos per condition. (E) Wild‐type zebrafish embryos were injected with MO at 1‐cell stage, treated with DMSO or FK506 at 21 hpf, and then subjected to whole‐mount ISH with riboprobes against cmlc2 at 3 dpf. Dorsal views of endogenous cmlc2 mRNA expression pattern were observed. Scale bar, 75 μm. (F‐G) Experiments were performed as in (D), heart rate and fractional shortening (FS) of the ventricular chamber were measured. **P < .01, *P < .05 compared with controls. (H) nppb::F‐luc embryos were injected with ndufa7 splice‐blocking MO or control MO at 1‐cell stage, treated with FK506 or 0.5% DMSO at 21 hpf, and collected at 3 dpf for the luciferase assay. The experiments were performed in triplicate, with 50 individuals per condition. Statistical test: Student's t test. **P < .01 compared with control MO group, n = 30 measurements per condition. (I‐J) cmlc2::GFP embryos were injected with ndufa7 MO or control MO at 1‐cell stage, and treated with 0.5% DMSO or FK506. RNA was extracted from harvested embryo hearts at 3 dpf to examine the mRNA expression level of nppa and nppb. The experiments were performed in triplicate, with 60 individuals per condition. Statistical test: Student's t test. **P < .01 compared with control MO group or DMSO vehicle group, n = 6 measurements per condition

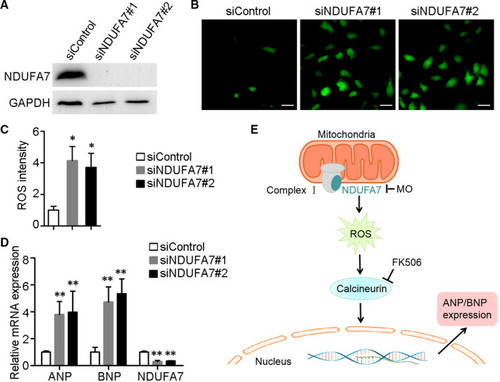
Depletion of NDUFA7 leads to cardiac hypertrophy in H9c2 cells. (A) H9c2 cells were transfected with control or NDUFA7 siRNAs for 72 hours, and expression level of NDUFA7 and GAPDH were examined. (B) H9c2 cells transfected with control or NDUFA7 siRNAs were stained for ROS using 2’,7’‐dichlorofluorescin diacetate, and then visualized under the fluorescence microscope. Scale bar, 50 µm. (C) Experiments were performed as in (B), and the ROS intensity in each group were examined by ImageJ. *P < .05 compared with control group. (D) H9c2 cells transfected with control or NDUFA7 siRNAs for 72 h, RNA was then extracted for RT‐qPCR analysis. **P < .01 compared with control group. (E) Schematic representation of the proposed mechanism. Depletion of ndufa7 triggered ROS production and subsequent calcineurin signalling activation, which further led to the expression of cardiac hypertrophy genes

Acknowledgments
This image is the copyrighted work of the attributed author or publisher, and ZFIN has permission only to display this image to its users. Additional permissions should be obtained from the applicable author or publisher of the image. Full text @ J. Cell. Mol. Med.