FIGURE SUMMARY
Title

ADP-dependent glucokinase as a novel onco-target for haematological malignancies

Authors
Tandon, A., Birkenhagen, J., Nagalla, D., Kölker, S., Sauer, S.W.
Source
Full text @ Sci. Rep.

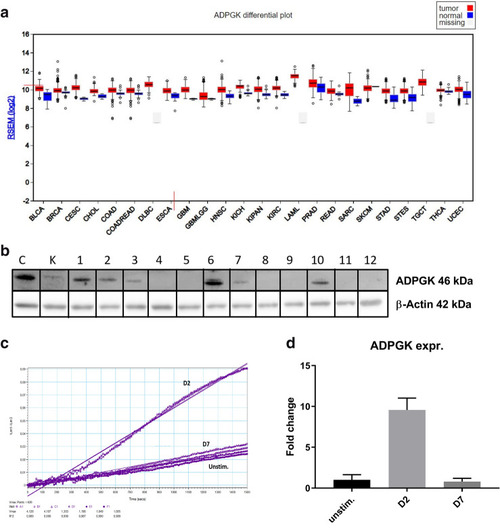
ADPGK activity and expression upon stimulation. (a) Expression data for ADPGK in normal and tumour samples in the TCGA (The Cancer Genome Atlas) FireBrowse expression viewer. Tumour expression- red blocks; Normal tissue expression- blue blocks (b) ADPGK knock-outs were generated via CRISPR/Cas9 technology targeting exon-2 of ADPGK. ADPGK (ADP dependent glucokinase) knock-out selection via western blot using 46 kDa band as reference. β-actin is the loading control. Lanes 1–12 depict 12 analysed clones. Lanes 4 and 8 were selected as KO-1 and KO-2 respectively. Ramos BL (Burkitt's lymphoma) cells were stimulated with 50 ng/ml PMA (phorbol-12 myristate 13-acetate) for a period of seven days and analysed at D2 (two days post stimulation) and D7 (seven days post stimulation). (c) Enzyme kinetics of ADPGK at D2, D7 and unstim. (unstimulated) states. X-axis represents time in seconds and y-axis is difference in absorbance between 340 and 400 nm. (d) Change in ADPGK expression upon stimulation at D2, D7 and unstimulated states using RT-qPCR. Data is representative of three individual experiments. Error bars represent + /- s.e.m. C is positive control and K negative control for ADPGK. TCGA cancer nomenclature is available at https://gdc.cancer.gov/resources-tcga-users/tcga-code-tables/tcga-study-abbreviations.

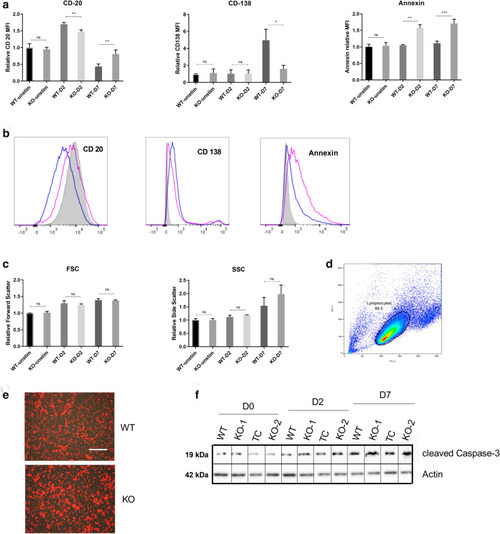
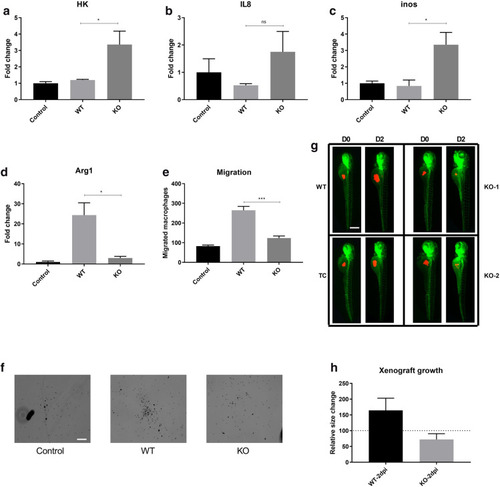
PMA stimulation induced differentiation is hampered in ADPGK KO cells. (a) ADPGK (KO and WT cells were treated with 50 ng/ml PMA (phorbol-12 myristate 13-acetate) and cultured for seven days under standard conditions. Flow cytometric analysis was performed for cells collected at D0, D2 and D7 (unstimulated, two days stimulated, and seven days) post stimulation. Panel a shows the change in Relative Fluorescence Intensity (RFI), from PE (CD20 and CD138) or FITC (Annexin V) tagged fluorescent antibodies. (b) The same data represented as histogram of D7 (differentiation phase) fluorescence intensities for respective markers; pink line represents KO cells, blue WT and shaded area as unstimulated WT cells serving as control. (c) Forward and side scatter values generated by the flow cytometry experiments on various days for WT and KO cells. (d) Gating strategy for excluding cell debris and clumps from analysis with automated area selection for lymphocytes using FlowJo software. Percentage of gated cells used for further analysis is shown by the number in the box. (e) Microscopic images of cells collected at D7 and displaying fluorescence for AnnexinV at 10 × magnification. Scale bar corresponds to 200 µm. (f) Western blot for Ramos WT and ADPGK KO cells at D0, D2 and D7, probed for cleaved Caspase-3 with β-Actin as loading control. Error bars represent + /- s.e.m of RFI (for CD20, CD138 and AnnexinV) or FSC/SSC values obtained from three independent experiments. y-axis for bar-graphs represents mean values of each sample normalized to unstimulated WT cells. x-axis in histograms shows fluorescence intensity. 100,000 events were recorded for each flow cytometry experiment. (*p < 0.05; **p < 0.01, ***p < 0.001, calculated using Welch’s t-test for significance).

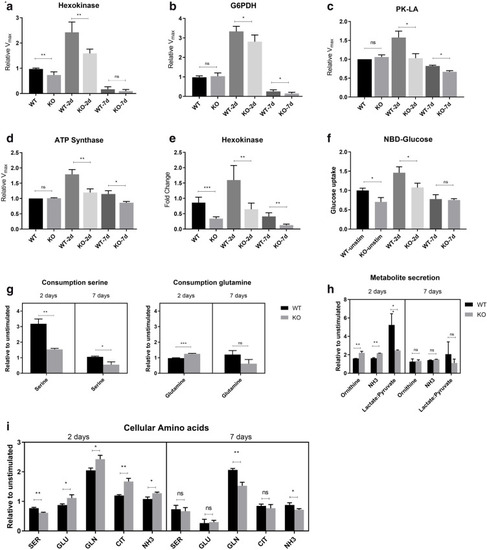
ADPGK KO B-cells are metabolically toxified. (a)(d) ADPGK KO and WT cells were analysed for aerobic glycolysis upon stimulation with PMA by measurement of enzyme activities of Hexokinase-2, G6PDH (Glucose 6-phophate dehydrogenase), Pyruvate kinase M2-dimeric (PK-LA) and ATP synthase spectrophotometrically; RT-qPCR for hexokinase-2 (e) for gene expression, and (f) accumulated FITC-NBD-glucose (2-(N-(7-Nitrobenz-2-oxa-1,3-diazol-4-yl) Amino)-2-Deoxyglucose) via flow cytometry for glucose uptake. (g) Serine and Glutamine consumption in Ramos WT and ADPGK KO cells at D2, D7 normalized to their respective unstimulated values. (h) Secreted metabolites in culture media at D2, D7; lactate:pyruvate levels for estimation of Warburg phenotype and Ornithine, NH3 values for glutamine metabolism, normalized to respective unstimulated conditions. (i) Intracellular amino acids and metabolites measured in ADPGK KO and Ramos WT cell lysates at two and seven days post stimulation with PMA. Data shown are normalized to the respective unstimulated controls. SER- Serine, GLU- Glutamic acid, GLN- Glutamine, CIT- Citrate, NH3-Ammonia. All graphs are representative of three independent experiments. WT, KO: mean of values from two wild-type and two ADPGK knock-out cell lines, obtained from three independent experiments. y-axis in all graphs, except amino-acid consumption and metabolite secretion, represents respective raw values normalized to unstimulated WT cells. (*p < 0.05; **p < 0.01, ***p < 0.001, calculated using Welch’s t-test for significance).

MYC expression and mutational status are dependent on glucose metabolism. MYC (translocated and wild-type) expression in ADPGK KO and WT cells at different time points post stimulation was measured via RT-qPCR and protein content via western blots. (a) Expression of MYC at D0, D2 and D7 post stimulation. y-axis represents fold change normalized to unstimulated WT cells. (b) Protein blot of MYC and β-Actin loading control, with quantification of bands in (c) using ImageJ software. (d) Transcripts obtained at D0, D2 and D7 were sequenced and aligned with wild type MYC to analyse mutations in translocated allele. Panel d is a 10 × 10 dot plot for representation of observed mutations in WT and KO cells at D0, D2 and D7 post stimulation. Each dot corresponds to one percent. Total number of observed mutations for each cell line are given below the plots. (e) Representative figure showing the distribution of random mutations and their preferential targeting to AGC sites with respect to wild type MYC (topmost highlighted sequence). (f) RT-qPCR expression data for AID (activation-induced cytidine deaminase) in WT and KO cells at different time points post stimulation. Expression analysis and protein blots are representative of three individual experiments. Error bars show + /- s.e.m. Mutational analysis was performed with sixty-five individual MYC transcripts obtained from WT and KO cells at different time points. Sequences were aligned in Geneious software and figures exported are depicted. WT, KO: mean of values from two wild-type and two ADPGK knock-out cell lines, obtained from three independent experiments. (*p < 0.05; **p < 0.01, ***p < 0.001, calculated using Welch’s t-test for significance).

In-vitro and in-vivo analysis of tumour aggressiveness in ADPGK KO and Ramos WT cells. (a)(d) PMA activated THP-1 monocytes were co-cultured with stimulated WT Ramos or ADPGK KO cells for a period of 48 h. Monocyte-macrophages collected post co-culture with Ramos WT or ADPGK KO cells were analysed via RT-qPCR for expression of M1, M2 markers in form of Hexokinase, IL-8, inducible nitric oxide synthase (iNOS) and Arginase-1. PMA activated THP-1 cells without a co-culture setup served as control for the experiment. (e) The migration of THP-1 monocyte/macrophages was studied in presence of WT or ADPGK KO cells. Media without WT/KO cells served as control. The quantification of migrated THP-1 cells post 6 h of incubation is represented as cell numbers on y-axis. (f) Microscopic images representing migrated THP-1 cells upon co-culture with WT and KO cells (g), (h) Approximately 200–250 CM-diI labelled cells (WT or KO) were injected in yolk of 48 h post fertilization (hpf) kdrl:GFP zebrafish larvae. Images in (g) show the progression of xenografted cells over two days post injection (D0–D2) in Ramos wild type (WT) and transfection control (TC) and ADPGK knock-out (KO-1, KO-2) cells. Xenograft area quantified using ImageJ for 50 larvae injected with Ramos WT and another 50 with ADPGK KO cells and mean calculated over three individual experiments is shown in (h). WT, KO: mean of values from two wild-type and two ADPGK knock-out cell lines in all bar-graphs. Error bars show + /− s.e.m. Scale bar corresponds to 400 µm. Dpi is Days post injection. (*p < 0.05; **p < 0.01, ***p < 0.001, calculated using Welch’s t-test for significance).

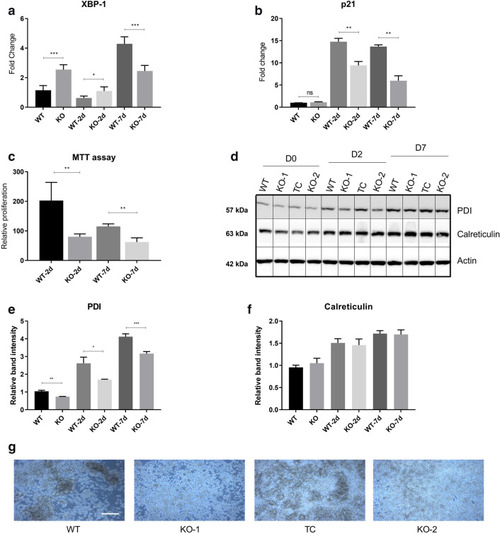
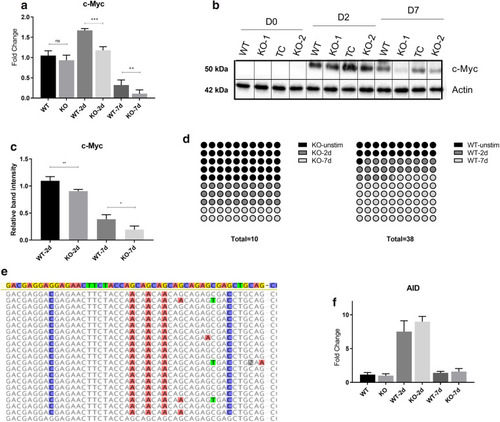
ER stress-based differentiation markers are more expressed in Ramos WT cells. ADPGK KO and Ramos WT cells, treated with PMA and cultured for seven days under standard conditions were analysed via western blot and RT-qPCR at D0, D2 and D7 post stimulation. (a) Results of RT-qPCR performed for detecting ratio of spliced:unspliced XBP1 transcript in ADPGK KO and Ramos WT cells at different conditions. y-axis represents fold change in expression of all samples normalized to unstimulated WT cells. (b) RT-qPCR analysis for cell-cycle regulator p21 (CDKN1A) in Ramos WT and ADPGK KO cells at different PMA stimulation time points (c) MTT assay to analyse the proliferation rate of ADPGK KO and Ramos WT cells upon stimulation with PMA. Data presented is normalized to the respective unstimulated controls. (d) Western blots for Ramos WT and ADPGK KO cells at D0, 2 and 7 with β-Actin as loading control. (e), (f) Quantification of band intensities using ImageJ software. All graphs are representative of three independent experiments (g) Homotypic aggregates observed at 5 × magnification under a light microscope at D7 in PMA stimulated WT and KO cells. WT, KO: mean of values from two wild-type and two ADPGK knock-out cell lines, obtained from three independent experiments. Scale bar corresponds to 400 µm. For western blots, TC is transfection control and the two knock-out lines as KO-1 and KO-2. y-axis in all graphs represents respective raw values normalized to unstimulated WT cells. (*p < 0.05; **p < 0.01, ***p < 0.001, calculated using Welch’s t-test for significance).

Acknowledgments
This image is the copyrighted work of the attributed author or publisher, and ZFIN has permission only to display this image to its users. Additional permissions should be obtained from the applicable author or publisher of the image. Full text @ Sci. Rep.