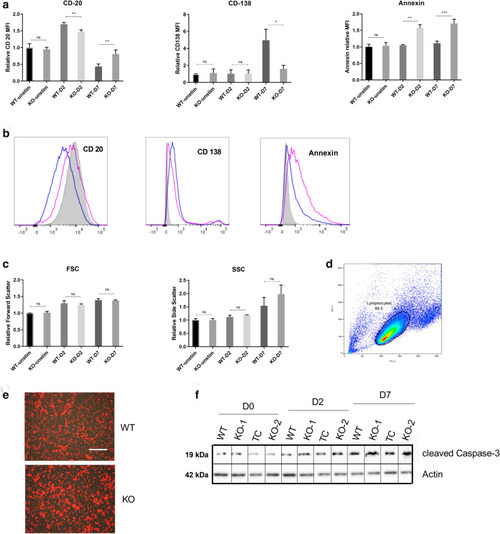
PMA stimulation induced differentiation is hampered in ADPGK KO cells. (a) ADPGK (KO and WT cells were treated with 50 ng/ml PMA (phorbol-12 myristate 13-acetate) and cultured for seven days under standard conditions. Flow cytometric analysis was performed for cells collected at D0, D2 and D7 (unstimulated, two days stimulated, and seven days) post stimulation. Panel a shows the change in Relative Fluorescence Intensity (RFI), from PE (CD20 and CD138) or FITC (Annexin V) tagged fluorescent antibodies. (b) The same data represented as histogram of D7 (differentiation phase) fluorescence intensities for respective markers; pink line represents KO cells, blue WT and shaded area as unstimulated WT cells serving as control. (c) Forward and side scatter values generated by the flow cytometry experiments on various days for WT and KO cells. (d) Gating strategy for excluding cell debris and clumps from analysis with automated area selection for lymphocytes using FlowJo software. Percentage of gated cells used for further analysis is shown by the number in the box. (e) Microscopic images of cells collected at D7 and displaying fluorescence for AnnexinV at 10 × magnification. Scale bar corresponds to 200 µm. (f) Western blot for Ramos WT and ADPGK KO cells at D0, D2 and D7, probed for cleaved Caspase-3 with β-Actin as loading control. Error bars represent + /- s.e.m of RFI (for CD20, CD138 and AnnexinV) or FSC/SSC values obtained from three independent experiments. y-axis for bar-graphs represents mean values of each sample normalized to unstimulated WT cells. x-axis in histograms shows fluorescence intensity. 100,000 events were recorded for each flow cytometry experiment. (*p < 0.05; **p < 0.01, ***p < 0.001, calculated using Welch’s t-test for significance).
|
