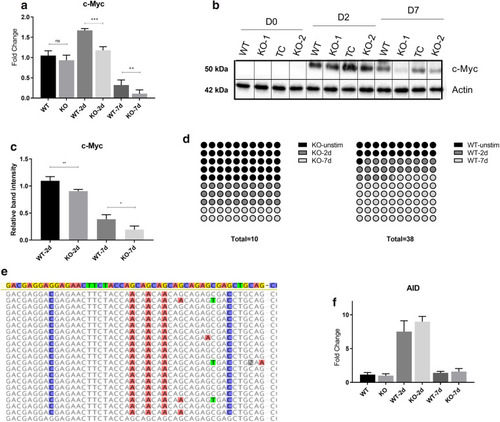
MYC expression and mutational status are dependent on glucose metabolism. MYC (translocated and wild-type) expression in ADPGK KO and WT cells at different time points post stimulation was measured via RT-qPCR and protein content via western blots. (a) Expression of MYC at D0, D2 and D7 post stimulation. y-axis represents fold change normalized to unstimulated WT cells. (b) Protein blot of MYC and β-Actin loading control, with quantification of bands in (c) using ImageJ software. (d) Transcripts obtained at D0, D2 and D7 were sequenced and aligned with wild type MYC to analyse mutations in translocated allele. Panel d is a 10 × 10 dot plot for representation of observed mutations in WT and KO cells at D0, D2 and D7 post stimulation. Each dot corresponds to one percent. Total number of observed mutations for each cell line are given below the plots. (e) Representative figure showing the distribution of random mutations and their preferential targeting to AGC sites with respect to wild type MYC (topmost highlighted sequence). (f) RT-qPCR expression data for AID (activation-induced cytidine deaminase) in WT and KO cells at different time points post stimulation. Expression analysis and protein blots are representative of three individual experiments. Error bars show + /- s.e.m. Mutational analysis was performed with sixty-five individual MYC transcripts obtained from WT and KO cells at different time points. Sequences were aligned in Geneious software and figures exported are depicted. WT, KO: mean of values from two wild-type and two ADPGK knock-out cell lines, obtained from three independent experiments. (*p < 0.05; **p < 0.01, ***p < 0.001, calculated using Welch’s t-test for significance).
|
