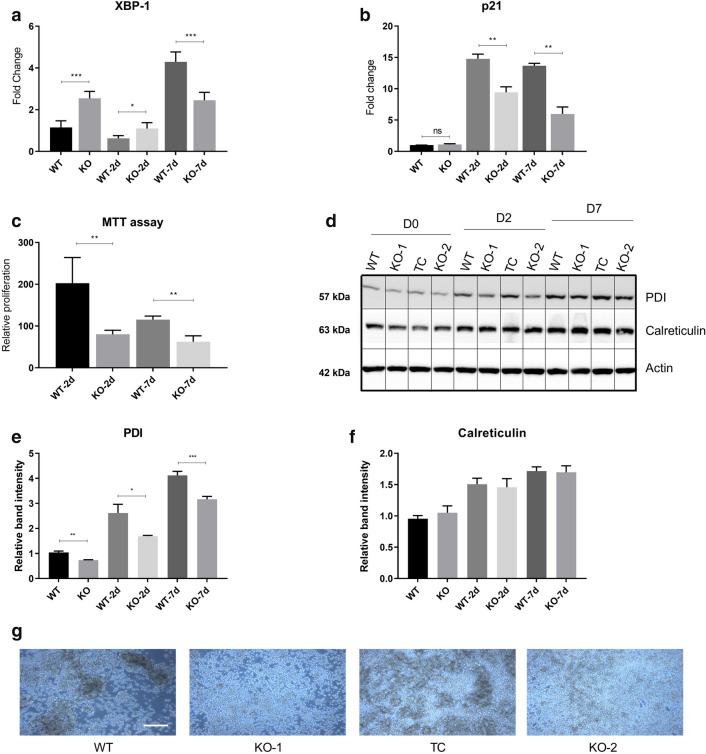
IMAGE

Figure.3

ID
ZDB-IMAGE-200819-4
Source
Figures for Tandon et al., 2020
Image
Figure Caption

Figure.3

ER stress-based differentiation markers are more expressed in Ramos WT cells. ADPGK KO and Ramos WT cells, treated with PMA and cultured for seven days under standard conditions were analysed via western blot and RT-qPCR at D0, D2 and D7 post stimulation. (a) Results of RT-qPCR performed for detecting ratio of spliced:unspliced XBP1 transcript in ADPGK KO and Ramos WT cells at different conditions. y-axis represents fold change in expression of all samples normalized to unstimulated WT cells. (b) RT-qPCR analysis for cell-cycle regulator p21 (CDKN1A) in Ramos WT and ADPGK KO cells at different PMA stimulation time points (c) MTT assay to analyse the proliferation rate of ADPGK KO and Ramos WT cells upon stimulation with PMA. Data presented is normalized to the respective unstimulated controls. (d) Western blots for Ramos WT and ADPGK KO cells at D0, 2 and 7 with β-Actin as loading control. (e), (f) Quantification of band intensities using ImageJ software. All graphs are representative of three independent experiments (g) Homotypic aggregates observed at 5 × magnification under a light microscope at D7 in PMA stimulated WT and KO cells. WT, KO: mean of values from two wild-type and two ADPGK knock-out cell lines, obtained from three independent experiments. Scale bar corresponds to 400 µm. For western blots, TC is transfection control and the two knock-out lines as KO-1 and KO-2. y-axis in all graphs represents respective raw values normalized to unstimulated WT cells. (*p < 0.05; **p < 0.01, ***p < 0.001, calculated using Welch’s t-test for significance).

Acknowledgments
This image is the copyrighted work of the attributed author or publisher, and ZFIN has permission only to display this image to its users. Additional permissions should be obtained from the applicable author or publisher of the image. Full text @ Sci. Rep.