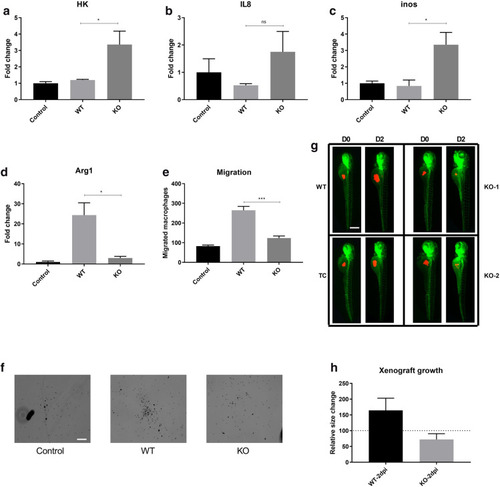
In-vitro and in-vivo analysis of tumour aggressiveness in ADPGK KO and Ramos WT cells. (a)–(d) PMA activated THP-1 monocytes were co-cultured with stimulated WT Ramos or ADPGK KO cells for a period of 48 h. Monocyte-macrophages collected post co-culture with Ramos WT or ADPGK KO cells were analysed via RT-qPCR for expression of M1, M2 markers in form of Hexokinase, IL-8, inducible nitric oxide synthase (iNOS) and Arginase-1. PMA activated THP-1 cells without a co-culture setup served as control for the experiment. (e) The migration of THP-1 monocyte/macrophages was studied in presence of WT or ADPGK KO cells. Media without WT/KO cells served as control. The quantification of migrated THP-1 cells post 6 h of incubation is represented as cell numbers on y-axis. (f) Microscopic images representing migrated THP-1 cells upon co-culture with WT and KO cells (g), (h) Approximately 200–250 CM-diI labelled cells (WT or KO) were injected in yolk of 48 h post fertilization (hpf) kdrl:GFP zebrafish larvae. Images in (g) show the progression of xenografted cells over two days post injection (D0–D2) in Ramos wild type (WT) and transfection control (TC) and ADPGK knock-out (KO-1, KO-2) cells. Xenograft area quantified using ImageJ for 50 larvae injected with Ramos WT and another 50 with ADPGK KO cells and mean calculated over three individual experiments is shown in (h). WT, KO: mean of values from two wild-type and two ADPGK knock-out cell lines in all bar-graphs. Error bars show + /− s.e.m. Scale bar corresponds to 400 µm. Dpi is Days post injection. (*p < 0.05; **p < 0.01, ***p < 0.001, calculated using Welch’s t-test for significance).
|
