FIGURE SUMMARY
Title

UVB Irradiation Induced Cell Damage and Early Onset of Junbb Expression in Zebrafish

Authors
Chen, R.Y., Lin, C.J., Liang, S.T., Villalobos, O., Villaflores, O.B., Lou, B., Lai, Y.H., Hsiao, C.D.
Source
Full text @ Animals (Basel)

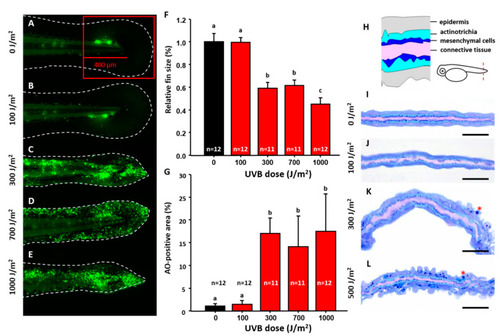
Optimization of UVB irradiation dosage to induce caudal fin damage in zebrafish. Zebrafish embryos aged 3 dpf were exposed to UVB irradiation at different doses of 0 (A), 100 (B), 300 (C), 700 (D), and 1000 (E) J/m2. Twenty-four hours post irradiation, embryos were stained with acridine orange (AO) to detect apoptosis and the relative size of caudal fin was calculated and compared. (F) Quantitative measurement of caudal fin area under different doses of UVB irradiation. (G) Quantitative measurement of cell apoptosis under different doses of UVB irradiation. The apoptosis was detected by AO staining. One-way ANOVA test was conducted to determine the significance. Column with the same label indicates statistic insignificance. Semi-thin section was conducted to compare the morphology in caudal fin at different doses from 0 (I), 100 (J), 300 (K), and 500 (L) J/m2. The cellular organization of a cross-section of caudal fin is illustrated in (H). Scale bar = 25 um in (IL).

Time course changes of caudal fin in zebrafish after UVB irradiation. Zebrafish embryos aged 3 dpf were irradiated with UVB at doses of 300 J/m2. (FJ) The embryos were then collected at 3, 9, 14, 19, and 24 h after irradiation and subjected to AO staining to detect apoptosis and measuring the relative size of caudal fin. The control group was for comparison (AE). (K) Dynamic changes of the relative caudal fin size in zebrafish with UVB irradiation at dose of 300 J/m2. (L) Dynamic changes of the relative apoptotic cells with UVB irradiation at a dose of 300 J/m2. (MQ) Semi-thin sectioning was conducted to compare the interior morphology of caudal fin under UVB irradiation at a dose of 300 J/m2. (n = 5–15. Student’s t-test was performed on data from experiments. * p < 0.05, ** p < 0.01, *** p < 0.001). Scale bar = 25 μm in (MQ).

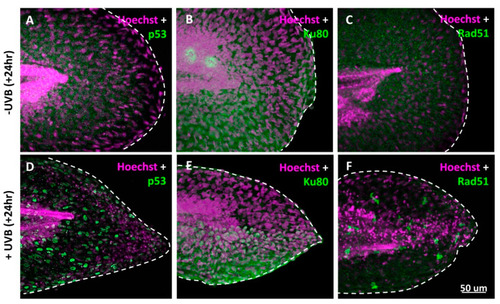
UVB activates p53 and DNA damage in zebrafish. Embryos aged 3 dpf were irradiated with UVB (+UVB) at a dose of 300 J/m2. Twenty-four hours later, the irradiated embryos were fixed and stained with p53, Ku80, and Rad51 antibodies. Embryos without (AC) or with UVB irradiation (DF) were stained with p53 (green) and Hoechst (purple) antibodies and detected under high-resolution confocal microscopy. The p53 protein translocated to the nucleus of cells undergoing apoptosis at 19 h after 300 J/m2 UVB irradiation.

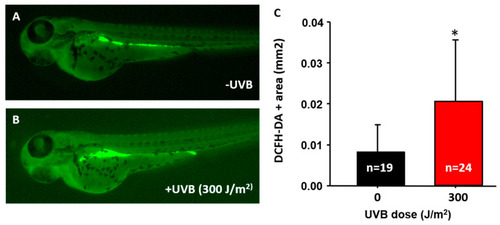
UVB induces zebrafish cells to produce reactive oxygen species (ROS). Embryos aged 3 dpf were irradiated with UVB at 300 J/m2. Embryos were stained with 40 μM DCFH-DA to detect the ROS. ROS expression without (A) and with (B) 300 J/m2 of UVB irradiation at 4 dpf. (C) The intracellular ROS signals were statistically quantified by the relative intensity of ROS fluorescent signals. ROS increased after exposure to UVB at 300 J/m2. (n = 19–24. Student’s t-test was performed on data from experiments. * p < 0.05).

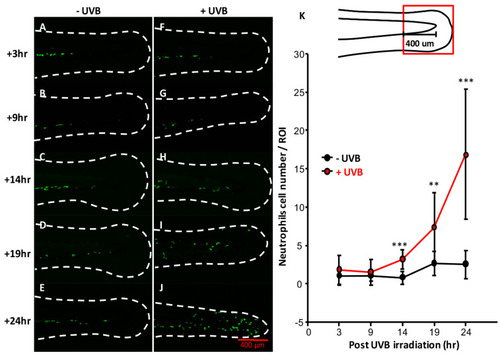
UVB irradiation induces inflammation in zebrafish. Neutrophils reporter line Tg (mpo: GFP) was generated to detect inflammation. (AE) Embryos aged 3 dpf without UVB irradiation at different time points. (FJ) Neutrophils number of caudal fin area over the intermediate cell mass from 3 h to 14 h post-irradiation was counted. (K) Number of neutrophils within 400 μm region (red box) was calculated. (FG) Neutrophils did not shift to caudal fin before 9 h post-irradiation. (H) After 14 h post-irradiation, neutrophils started to migrate to caudal fin. (I,J) Neutrophils continuously migrated from 19 h after irradiation to 24 h. (K) Quantification of the neutrophils at caudal fin. Neutrophils migration to caudal fin begins from 14 h post UVB irradiation and continued to 24 h post UVB irradiation. (n = 10–20, t-test was used to determine the significance change, * p < 0.05, ** p < 0.01, *** p < 0.001).

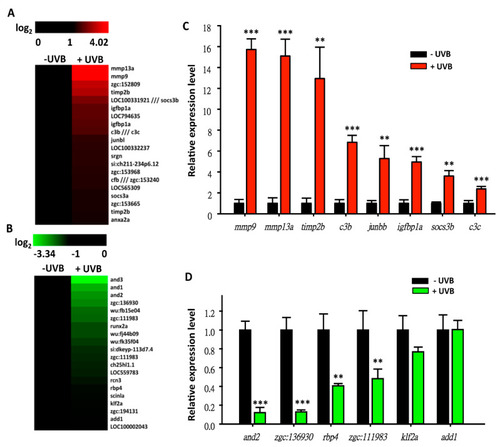
Microarray profiling of gene expression in zebrafish embryos after challenging with UVB irradiation. Heat map showed the upregulated genes (A) and the downregulated genes (B) with >1.5-fold difference after UVB irradiation. Validation of expression levels of upregulated (C) and downregulated (D) genes by qRT-PCR. These data showed log-ratios from a two-channel microarray. Gene expression of zebrafish aged 4 dpf was detected after UVB irradiation at 3 dpf. (Three replicates were performed in RT-PCR, and a t-test was used to determine the significant difference. * p < 0.05, ** p < 0.01, *** p < 0.001).

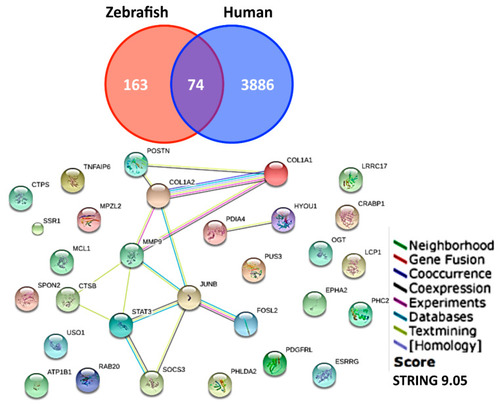
Functionally overlapping genes were compared between humans and zebrafish. (Upper panel) 74 genes’ expression were conserved between zebrafish and human skin (from literature) after UVB irradiation according to microarray data. (Lower panel) The overlapping expression genes were analyzed by STRING, a known database which predicts protein interactions including direct (physical) and indirect (functional) associations. The functions of overlapping genes between human and zebrafish are related to tissue reconstruction.

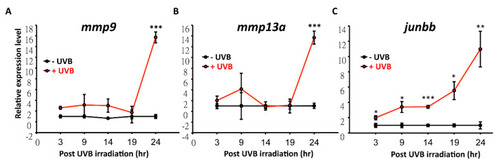
The temporal expression profiling of mmp9, mmp13a and junbb after UVB irradiation in zebrafish by quantitative real-time RT-PCR. (A) mmp9 and (B) mmp13a were not activated until 24 h after UVB irradiation. (C) junbb was sharply activated from 3 h onwards after UVB irradiation. The relative expression level for each transcript was normalized with β-actin. (Three replicates were performed in RT-PCR and the t-test was used to determine the significance of the results. * p < 0.05, ** p < 0.01, *** p < 0.001).

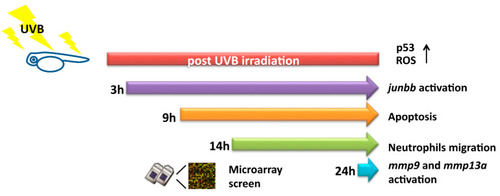
Summary of the cellular responses and gene expressions after UVB irradiation in zebrafish. Junbb, mmp9, and mmp13a were identified as UVB-inducible markers by using microarray screening.

Acknowledgments
This image is the copyrighted work of the attributed author or publisher, and ZFIN has permission only to display this image to its users. Additional permissions should be obtained from the applicable author or publisher of the image. Full text @ Animals (Basel)