
Image
|
Figure Caption
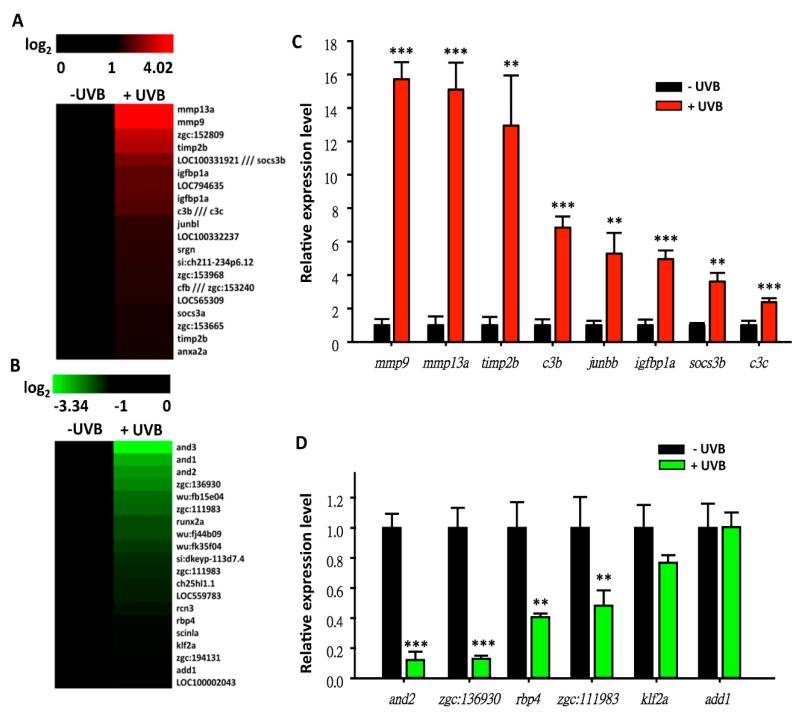
Figure 6
Microarray profiling of gene expression in zebrafish embryos after challenging with UVB irradiation. Heat map showed the upregulated genes (
Acknowledgments
This image is the copyrighted work of the attributed author or publisher, and
ZFIN has permission only to display this image to its users.
Additional permissions should be obtained from the applicable author or publisher of the image.
Full text @ Animals (Basel)