- Title
-
Nodal and Planar Cell Polarity signaling cooperate to regulate zebrafish convergence and extension gastrulation movements
- Authors
- Williams, M.L.K., Solnica-Krezel, L.
- Source
- Full text @ Elife
|
( |
|
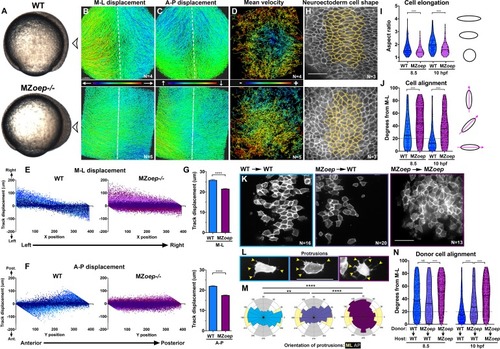
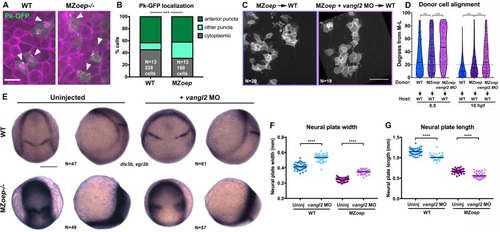
(A) Representative images of transplanted Prickle (Pk)-GFP donor cells (co-expressing H2B-RFP) within the neuroectoderm of membrane-labeled WT and MZoep–/– host gastrulae. Arrowheads indicate puncta at anterior edges. (B) Pk-GFP localization in the genotypes indicated. N indicates the number of embryos and cells analyzed for each condition from four independent trials, p<0.001, Chi-square test. (C) Representative images of membrane-labeled MZoep–/– donor cells without (left) and with (right) 2 ng MO4-vangl2 transplanted into the neuroectoderm of unlabeled host gastrulae from five independent trials. (D) Donor cell alignment as in Figure 1. The number of embryos in each condition is indicated on the corresponding panels in (C), WT→WT control N = 10. ***, p<0.001; ****, p<0.0001; K-S tests. (E) Whole mount in situ hybridization (WISH) for dlx3b and egr2b in WT (top) and MZoep–/– (bottom) gastrulae at 9.5 hpf, uninjected or injected with 2 ng MO4-vangl2. Dorsal views on the left, lateral views on the right. (F, G) Width (F) and length (G) of neural plates in the embryos depicted in (E). Each dot represents a single embryo, black bars are mean values. Number of embryos in each condition is indicated on the corresponding panel in (E), p<0.0001, Unpaired T-tests. Anterior is up in all images, scale bar is 20 μm in (A), 50 μm in (C), and 200 μm in (E). |
|
( |
|
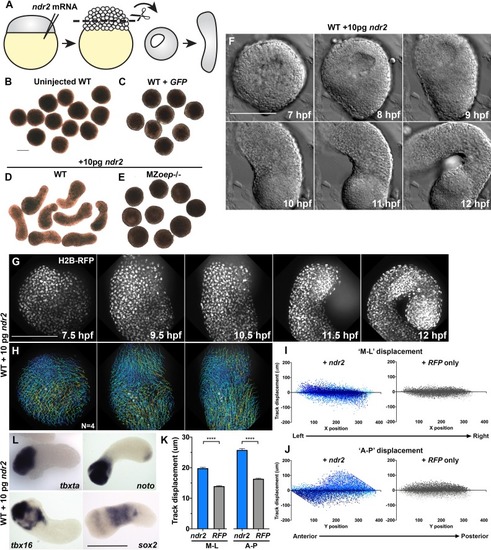
(A) Diagram of injection and explantation of zebrafish embryos. (B–E) Representative bright-field images of live blastoderm explants of the indicated conditions/genotypes at the equivalent of the 2–4 somite stage. (F) Time-lapse DIC series of a representative explant from a WT embryo injected with 10 pg ndr2 RNA. (G, H) Time-lapse series of H2B-RFP labeled nuclei (G) and automated cell tracking (H) within a representative explant from a WT embryo injected with 10 pg ndr2 RNA. Tracks represent cell movements over 3.5 hr of time-lapse confocal imaging beginning at 7.5 hpf and are colored according to mean track displacement. (I, J) Displacement of cell tracks in the ‘mediolateral’ (I) and ‘anteroposterior’ (J) dimensions in explants from ndr2-injected (blue) and control RFP-injected (gray) WT embryos (as in Figure 1). Each dot represents a single cell track, each color represents an individual explant. N = 4 explants of each condition from two independent trials. (K) Absolute displacement of cell tracks in the ML and AP dimensions. (L) Representative images of WISH for the transcripts indicated in explants from WT embryos injected with 10 pg ndr2 RNA. Scale bars are 200 μm |
|
( |
|
( |
|
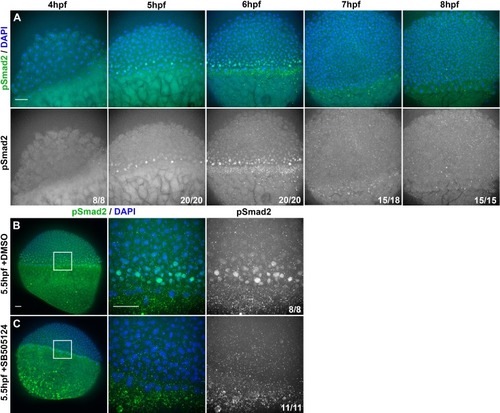
(A) Representative confocal images of immunofluorescent staining for phosphorylated Smad2 and DAPI-labeled nuclei in 8hpf explants from WT embryos injected with 10 pg ndr2. DAPI z-stacks were used to create a three-dimensional mask from which nuclear pSmad intensities were detected and measured in an automated fashion. (B, C) Axis position of pSmad2-positive nuclei (blue) and all nuclei (gray) in explants from WT embryos injected with 10 pg ndr2 (B) or uninjected (C) at the time points indicated. Each dot represents a single nucleus, pink bars are median values among pSmad2+ nuclei. N indicates the number of explants in each condition from five independent trials. Kolmogorov-Smirnov tests were used to compare the distribution of pSmad+ nuclei to all nuclei; ****, p<0.0001; **, p<0.01. (D) Representative images of WISH for lefty1 in uninjected (top) and ndr2-injected (bottom) explants fixed at the time points indicated. Scale bars are 100 μm |
|
( |
|
( |
|
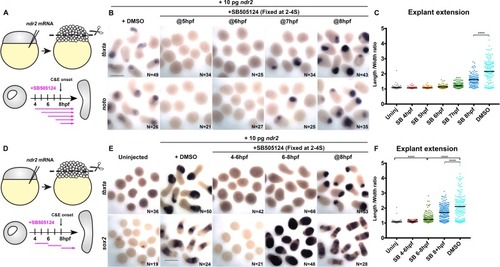
(A) Diagram of the time course of SB-505124 (SB) treatment of ndr2-expressing explants. (B) Representative images of WISH for the transcripts indicated in explants from WT embryos injected with 10 pg ndr2 RNA, treated with SB at the indicated time points, and fixed at the equivalent of the 2–4 somite stage from four independent trials. (C) Length/width ratios of explants shown in (B). Each dot represents a single explant, black bars are median values; p<0.0001, Mann-Whitney test. (D) Diagram of the time course of SB treatment of ndr2-expressing explants followed by washout. (E) Representative images of WISH for the indicated transcripts in explants from WT embryos injected with 10 pg ndr2 RNA, treated with SB at the indicated time points, and fixed at the equivalent of the 2–4 somite stage from four independent trials. (F) Length/width ratios of explants shown in (E), as in panel (C). ****p<0.0001, Mann-Whitney test. Scale bars are 300 μm |
|
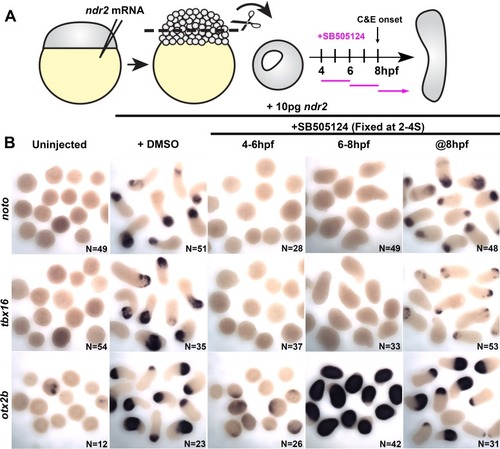
Representative images of WISH for the indicated transcripts in WT embryos treated with DMSO or SB-505124 beginning at 4–8 hpf and fixed at the two-somite stage. The scale bar is 300 μm. |
|
( |
|
In intact embryos (left), Nodal signaling acts largely in parallel with PCP signaling to regulate the ML cell polarization that underlies C and E. PCP signaling activity and localization of its components are regulated by an additional unknown signal(s) (X), and maintains residual polarizing activity in the absence of Nodal. In embryonic explants (right), PCP signaling activity and C and E cell behaviors are regulated wholly downstream of Nodal signaling. |

