
|
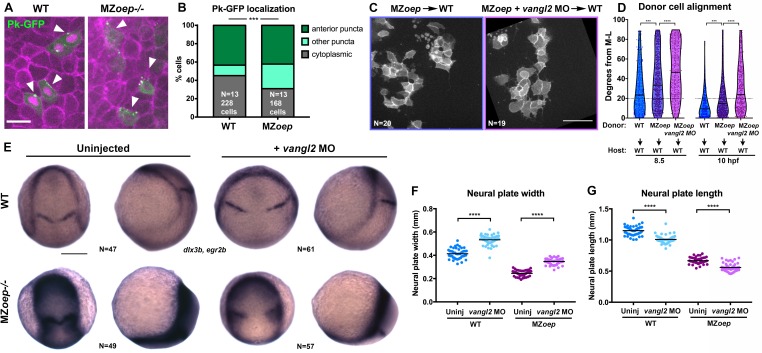
Figure 2 (A) Representative images of transplanted Prickle (Pk)-GFP donor cells (co-expressing H2B-RFP) within the neuroectoderm of membrane-labeled WT and MZoep–/– host gastrulae. Arrowheads indicate puncta at anterior edges. (B) Pk-GFP localization in the genotypes indicated. N indicates the number of embryos and cells analyzed for each condition from four independent trials, p<0.001, Chi-square test. (C) Representative images of membrane-labeled MZoep–/– donor cells without (left) and with (right) 2 ng MO4-vangl2 transplanted into the neuroectoderm of unlabeled host gastrulae from five independent trials. (D) Donor cell alignment as in Figure 1. The number of embryos in each condition is indicated on the corresponding panels in (C), WT→WT control N = 10. ***, p<0.001; ****, p<0.0001; K-S tests. (E) Whole mount in situ hybridization (WISH) for dlx3b and egr2b in WT (top) and MZoep–/– (bottom) gastrulae at 9.5 hpf, uninjected or injected with 2 ng MO4-vangl2. Dorsal views on the left, lateral views on the right. (F, G) Width (F) and length (G) of neural plates in the embryos depicted in (E). Each dot represents a single embryo, black bars are mean values. Number of embryos in each condition is indicated on the corresponding panel in (E), p<0.0001, Unpaired T-tests. Anterior is up in all images, scale bar is 20 μm in (A), 50 μm in (C), and 200 μm in (E).