|
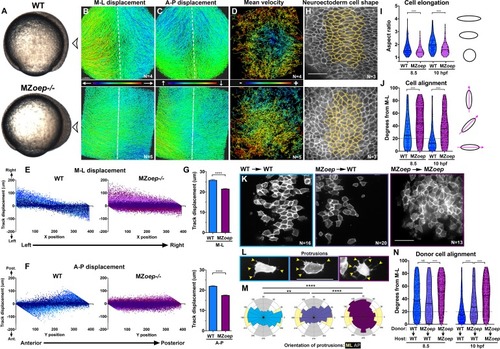
Nodal signaling regulates convergence and extension gastrulation cell behaviors.(A) Bright-field images of live WT and MZoep–/– embryos at 80% epiboly (8.5 hpf). The arrowheads indicate the point of view (dorsal side) for all fluorescent confocal micrographs. (B–D) Representative images of automated tracking of fluorescently labeled nuclei in the dorsal hemisphere of WT (top) and MZoep–/– (bottom) gastrulae. Tracks represent cell movements over three hours of time-lapse confocal imaging, beginning at 8.5 hpf, and are colored according to their displacement in the mediolateral (B) and anteroposterior (C) dimensions or the mean velocity of cell movement (D). Dotted lines indicate dorsal midline. (E, F) Displacement of cell tracks in the mediolateral (E) and anteroposterior (F) dimensions in WT (blue) and MZoep–/– (purple) gastrulae [as shown in (B–D]). Each dot represents a single cell track, each color represents an individual embryo, N = 4 WT and 5 MZoep–/–. (G) Absolute displacement of cell tracks in ML (top) and AP (bottom) dimensions. Bars are mean with 95% confidence interval, p<0.0001, Kolmogorov-Smirnoff (K-S) tests. (H) Representative images of membrane-labeled neuroectoderm in live WT (top) and MZoep–/– (bottom) gastrulae with cells outlined in yellow. (I, J) Neuroectoderm cell elongation (I) and alignment (J) at 8.5 hpf (left) and 10 hpf (right). Each dot represents a single cell, black bars are mean values in (I), and median values in (J). N = 3 embryos of each genotype, p<0.0001, Mann-Whitney test in (I), K-S test in (J). (K) Representative images of membrane-labeled donor cells of the indicated genotypes within the neuroectoderm of unlabeled host gastrulae. N indicates the number of embryos analyzed from three independent trials. (L) Representative images of protrusions (arrowheads) made by transplanted neuroectoderm cells of the genotypes/conditions indicated in (K). (M) The orientation of all protrusions between 8.5 and 10 hpf is shown in radial histograms divided into 20° bins, with 0 and 180 representing the ML axis. Yellow and gray quadrants represent ML- and AP-oriented protrusions, respectively. **, p=0.0053; ****, p<0.0001; Chi-square. (N) Alignment of donor cells as in (J). The number of embryos in each condition is indicated in the corresponding panels in (K). Anterior is up in all images, scale bars are 50 μm. Dotted lines in (J, N) show 20 degrees from ML for reference.
|

