
- Title
-
A Retino-retinal Projection Guided by Unc5c Emerged in Species with Retinal Waves
- Authors
- Murcia-Belmonte, V., Coca, Y., Vegar, C., Negueruela, S., de Juan Romero, C., Valiño, A.J., Sala, S., DaSilva, R., Kania, A., Borrell, V., Martinez, L.M., Erskine, L., Herrera, E.
- Source
- Full text @ Curr. Biol.
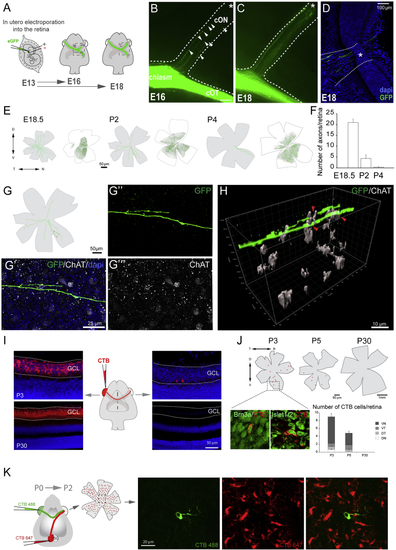
Characterization of Retino-retinal Cells in Mice (A) Labeled axons from embryos monocularly electroporated with EGFP-encoding plasmids at E13.5 were analyzed at E16.5 or E18.5. (B–D) At E16.5, EGFP-labeled axons are present within the contralateral optic nerve (cON) (arrowheads, B) and by E18.5 have reached the contralateral optic disc (asterisk, C and D). (E) Targeted cells (green dots) in retinas electroporated at E13.5 (white flat-mounted retinas) and tracings of EGFP-labeled axons in the contralateral retina (gray flat-mounted retinas) at E18.5–P4. (F) Mean (± SEM) number of R-R axons in E18.5–P4 retinas after electroporation of the opposite eye at E13.5. These numbers do not represent the total number of R-R neurons, as not all cells are targeted by electroporation. (G) Diagram of a P2 retina containing R-R axons labeled from the opposite eye. (G’–G’’’) Image of boxed area in (G) showing an EGFP R-R axon and starburst amacrine cells labeled with ChAT antibodies. (H) 3D reconstruction of z-projection with a z-step of 1.5 μm captured from boxed region in (G) showing ChAT+ cells embracing the axon terminal (red arrows). (I) Middle: diagram of monocular injection of CTB. Left: retinal sections of injected P3 and P30 mice injected with CTB 2 days earlier are shown. Right: retinal sections of contralateral retinas from same animals are shown. Note two retrogradely labeled cells in the RGC layer at P3. (J) Top: diagrams of whole-mount retinas retrogradely labeled with CTB at P3, P5, or P30. Boxed region of P3 retina shows retrogradely labeled cells (red) combined with antibody staining for Brn3a or Islet1/2 (green). Graph shows mean (± SEM) number of labeled cells/retina quadrant. At perinatal stages, most CTB-positive cells are in the ventral quadrants (ventronasal [VN] and ventrotemporal [VT]). At P30, no CTB cells were found. (K) CTB-488 (green) and CTB-647 (red) were injected in the retina and the ipsilateral superior colliculus (SC), respectively, of newborn mice. The opposite whole-mounted retina was analyzed 2 days later. Right: images from the boxed area show a representative CTB-488 cell negative for CTB-647. Error bars indicate ± SEM. See also |
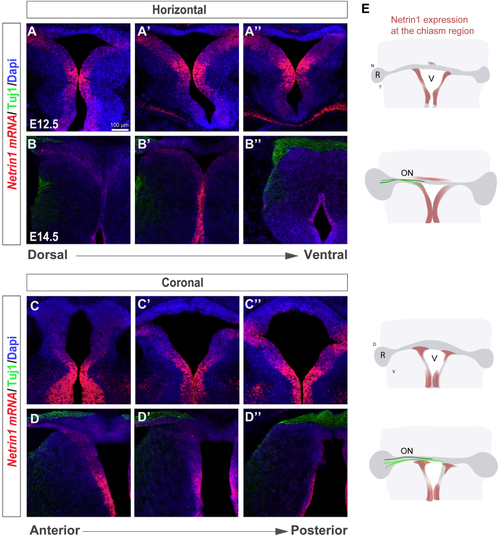
Netrin1 Is Expressed at the Developing Ventral Chiasm (A–D) Horizontal (A–B’’) and coronal (C–D’’) serial sections of E12.5 (A–A’’ and C–C’’) and E14.5 (B–B’’ and D–D’’) embryos at the level of the optic chiasm region stained by (E) Diagram summarizing the spatiotemporal expression of Netrin1 at the optic chiasm (red). RGC axons projecting to the brain (light green) or to the opposite optic nerve (dark green) are also represented. At E12.5, when RGC axons have not yet arrived at the chiasm, |
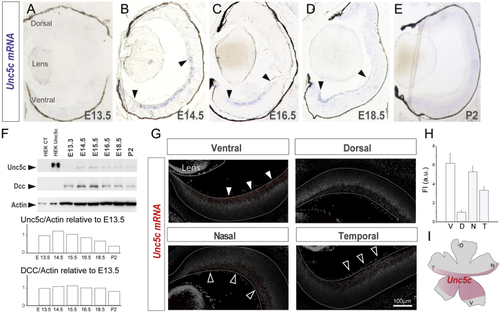
Unc5c Is Expressed in Ventral-Central Retina (A–E) (F) Immunoblot detection of Unc5c and Dcc in control (CT) HEK cells and HEK transfected with Unc5c encoding plasmids and in E13.5–P2 retinal lysates. β-actin was used as a loading control. Graphs show levels of Unc5c and Dcc normalized to actin levels. Peak of Unc5c expression is at E14.5. (G) Representative images of (H) Mean (± SEM) fluorescent intensity of (I) Diagram of a whole-mounted retina summarizing the expression of Error bars indicate ± SEM. See also |
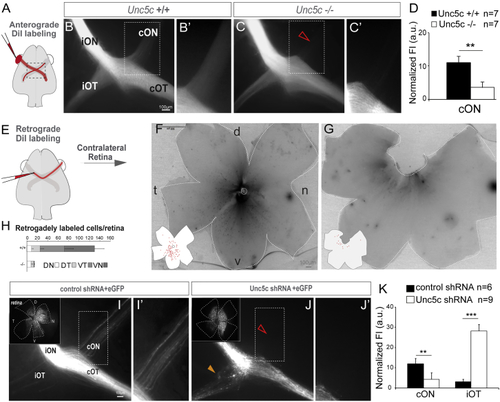
Unc5c Is Necessary for Establishment of the Retino-retinal Projection (A–C) DiI was placed into one eye and the labeled axons viewed at the chiasm (A). (B and C) DiI-labeled E17.5 Unc5c+/+ and Unc5c−/− embryos. The fluorescence intensity in the contralateral optic nerve of the Unc5c−/− embryo is decreased compared with the control littermate (arrowhead). (B’ and C’) Higher magnification of the boxed regions in (B) and (C). (D) Mean (± SEM) normalized fluorescence intensity (FI) in the contralateral optic nerve of E17.5 Unc5c−/− and wild-type embryos monocularly injected with DiI. (E–G) DiI was applied to one optic nerve and the opposite retina analyzed (E). (F and G) Whole-mounted retinas from E17.5 Unc5c+/+ and Unc5c−/− embryos retrogradely labeled with DiI. Inserts: tracings of the labeled cells are shown. (H) Mean (± SEM) number of retrogradely labeled cells in each quadrant of E17.5 wild-type and Unc5c mutant retinas. (I and J) E16.5 embryos electroporated at E13.5 with control or Unc5c shRNAs plus EGFP-encoding plasmids. Insert: corresponding whole-mounted electroporated retina is shown. EGFP-positive axons were present in the contralateral optic nerve of control (I and I’), but not Unc5c shRNA electroporated, embryos (open arrowhead, J and J’). Unc5c electroporated embryos also displayed an ectopic ipsilateral projection (orange arrowhead). (K) Mean (± SEM) normalized fluorescence intensity in the contralateral optic nerve and ipsilateral optic tract of E16.5 embryos electroporated at E13.5 with Unc5c shRNA or control shRNA. cON, contralateral optic nerve c; cOT, contralateral optic tract; D, dorsal; iON, ipsilateral optic nerve; iOT, ipsilateral optic tract; N, nasal; T, temporal; V, ventral. Error bars indicate ± SEM. (∗∗p < 0.01, ∗∗∗p < 0.001, Student’s unpaired t test). See also |
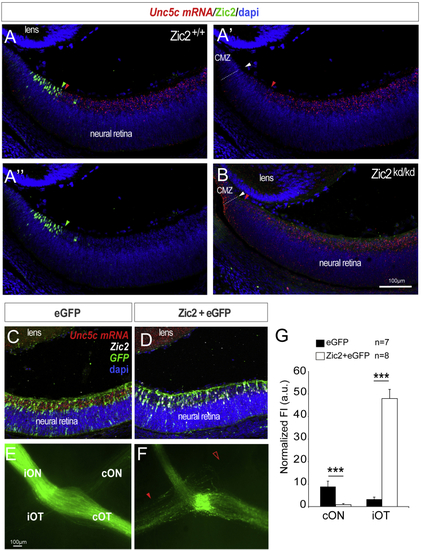
Ipsilateral RGCs Do Not Express Unc5c (A–A’’) ISH for (B) ISH for (C and D) ISH for (E and F) Optic chiasms from E16.5 embryos electroporated with plasmids encoding Zic2/EGFP (F) or EGFP alone (E). Red arrowhead indicates the ectopic ipsilateral projection in embryos electroporated with Zic2 and empty arrowhead the reduced number of EGFP-labeled axons in the contralateral optic nerve of Zic2 electroporated embryos compared to the control. (G) Mean (± SEM) normalized fluorescence intensity in the contralateral optic nerve and the ipsilateral optic tract of E16.5 embryos electroporated with plasmids encoding Zic2/EGFP or EGFP alone. Error bars indicate ± SEM. (∗∗p < 0.01, ∗∗∗p < 0.001, Student’s unpaired t test). |
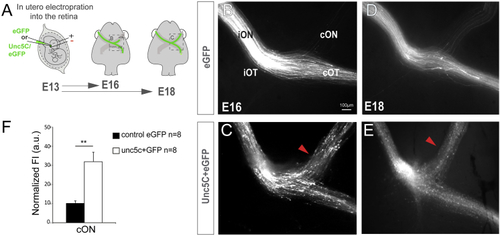
Unc5c Is Sufficient to Guide RGC Axons into the Opposite Optic Nerve (A) EGFP or Unc5c/GFP-encoding plasmids were electroporated into one eye of E13.5 embryos and axons growing into the opposite optic nerve analyzed at E16.5 or E18.5. (B–E) E16.5 (B and C) and E18.5 (D and E) embryos electroporated with Unc5c-encoding plasmids (C and E) display an increase in the number of R-R axons (arrowheads) compared to age-matched controls (B and D). (F) Mean (± SEM) normalized fluorescence intensity in the cON of E16.5 embryos after electroporation of EGFP or Unc5c/GFP-encoding plasmids. Error bars indicate ± SEM. (∗∗∗p < 0.001, Student’s unpaired t test). See also |
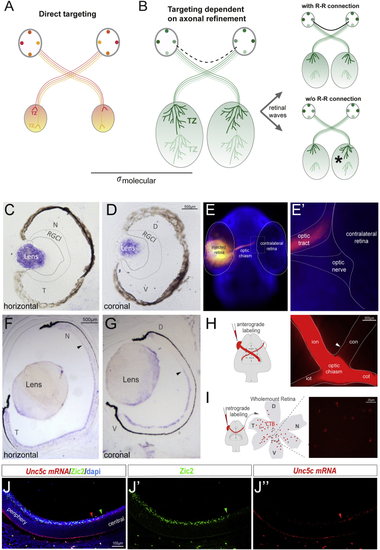
The R-R Connection through Evolution (A) Working model of the function of R-R in different species. In species where the size of the tectum and retina is similar, the establishment of bilaterally congruent maps may rely on point-to-point molecular tagging mechanisms. (B) In species where the size of the visual target is larger than the retina, map topography relies both on a molecular tagging mechanism and a later refinement process, dependent on waves of spontaneous activity. The presence of an R-R connection may enable the synchronization of retinal waves from each eye, driving symmetrical refinement in both hemispheres. (C and D) ISH for (E and E’) A 36- to 48-h post fertilization (hpf) zebrafish embryo stained with DAPI and monocularly injected with DiI shows no retinal axons entering into the contralateral retina. (F and G) ISH for (H) Schematic diagram representing monocular DiI anterograde labeling. Optic chiasm of a DiI-labeled P0 ferret is shown. White arrowhead points to the axons into the contralateral optic nerve. (I) Schematic diagram representing retrograde CTB-labeling. CTB injection was performed at P1, and labeled RGCs were visualized by red fluorescence in whole-mount retinas 1 day later. (J–J’’) ISH for CTB, cholera toxin subunit B-Alexa594; RGCl, retinal ganglion cell layer. See also |