
Figure 5
- ID
- ZDB-IMAGE-200423-89
- Publication
- Murcia-Belmonte et al., 2019 - A Retino-retinal Projection Guided by Unc5c Emerged in Species with Retinal Waves
- All Figures
- Figures for Murcia-Belmonte et al., 2019
|
Figure 5
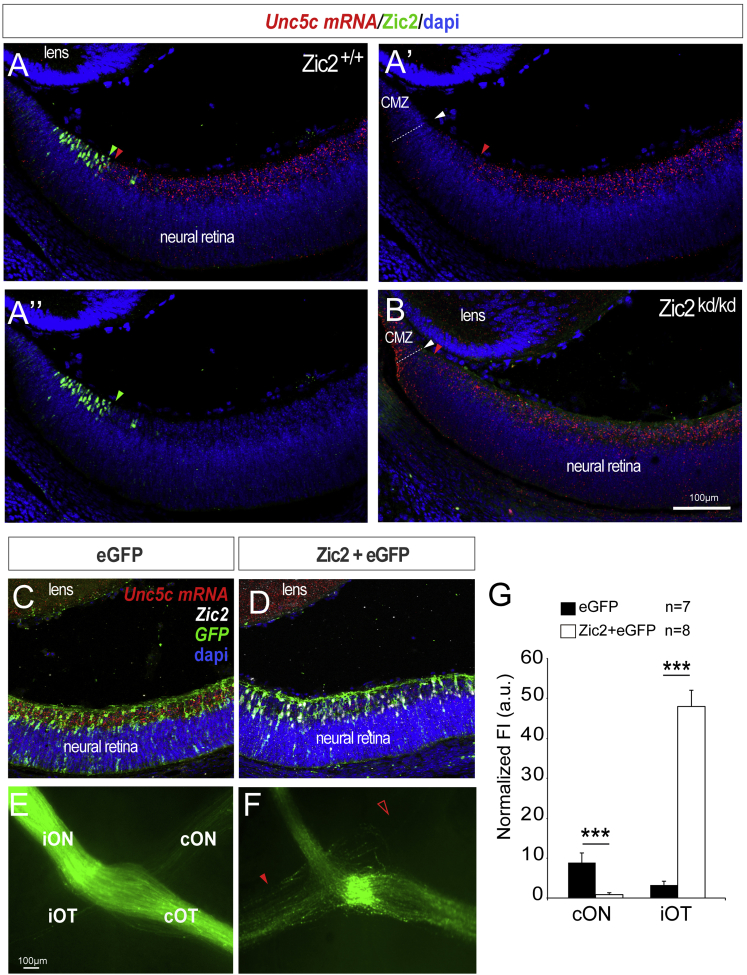
Ipsilateral RGCs Do Not Express Unc5c
(A–A’’) ISH for
(B) ISH for
(C and D) ISH for
(E and F) Optic chiasms from E16.5 embryos electroporated with plasmids encoding Zic2/EGFP (F) or EGFP alone (E). Red arrowhead indicates the ectopic ipsilateral projection in embryos electroporated with Zic2 and empty arrowhead the reduced number of EGFP-labeled axons in the contralateral optic nerve of Zic2 electroporated embryos compared to the control.
(G) Mean (± SEM) normalized fluorescence intensity in the contralateral optic nerve and the ipsilateral optic tract of E16.5 embryos electroporated with plasmids encoding Zic2/EGFP or EGFP alone.
Error bars indicate ± SEM. (∗∗p < 0.01, ∗∗∗p < 0.001, Student’s unpaired t test).