
Figure 7
- ID
- ZDB-IMAGE-200423-91
- Genes
- Publication
- Murcia-Belmonte et al., 2019 - A Retino-retinal Projection Guided by Unc5c Emerged in Species with Retinal Waves
- All Figures
- Figures for Murcia-Belmonte et al., 2019
|
Figure 7
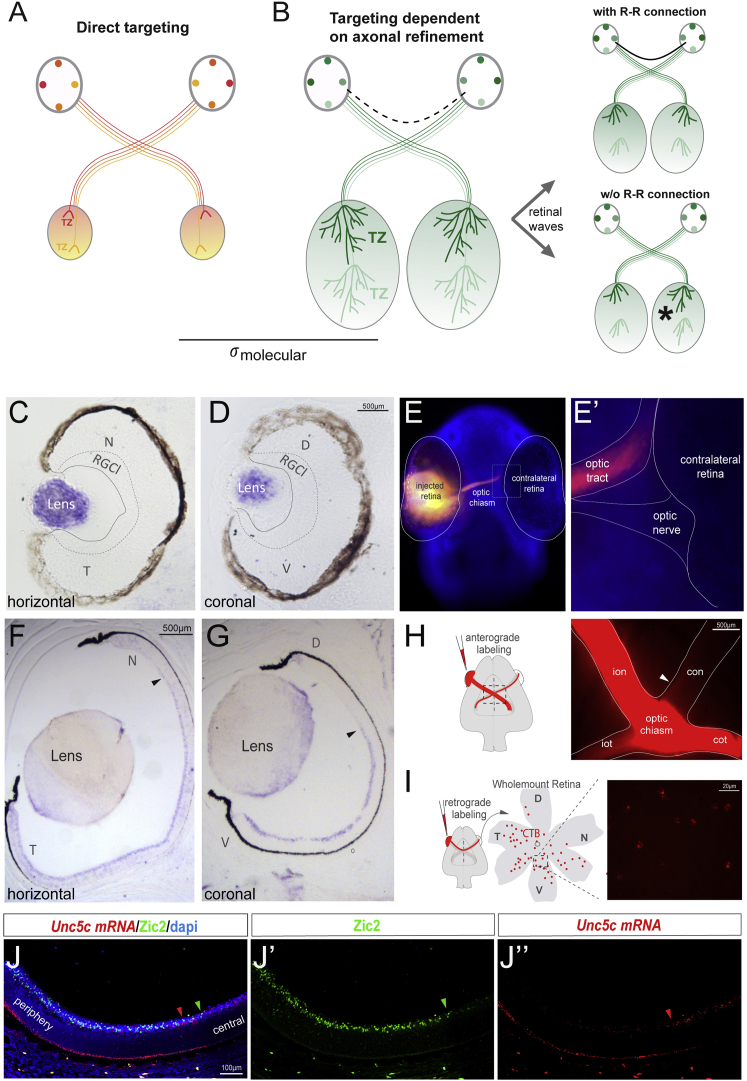
The R-R Connection through Evolution
(A) Working model of the function of R-R in different species. In species where the size of the tectum and retina is similar, the establishment of bilaterally congruent maps may rely on point-to-point molecular tagging mechanisms.
(B) In species where the size of the visual target is larger than the retina, map topography relies both on a molecular tagging mechanism and a later refinement process, dependent on waves of spontaneous activity. The presence of an R-R connection may enable the synchronization of retinal waves from each eye, driving symmetrical refinement in both hemispheres.
(C and D) ISH for
(E and E’) A 36- to 48-h post fertilization (hpf) zebrafish embryo stained with DAPI and monocularly injected with DiI shows no retinal axons entering into the contralateral retina.
(F and G) ISH for
(H) Schematic diagram representing monocular DiI anterograde labeling. Optic chiasm of a DiI-labeled P0 ferret is shown. White arrowhead points to the axons into the contralateral optic nerve.
(I) Schematic diagram representing retrograde CTB-labeling. CTB injection was performed at P1, and labeled RGCs were visualized by red fluorescence in whole-mount retinas 1 day later.
(J–J’’) ISH for
CTB, cholera toxin subunit B-Alexa594; RGCl, retinal ganglion cell layer. See also