
- Title
-
Anatomy and Connectivity of the Torus Longitudinalis of the Adult Zebrafish
- Authors
- Folgueira, M., Riva-Mendoza, S., Ferreño-Galmán, N., Castro, A., Bianco, I.H., Anadón, R., Yáñez, J.
- Source
- Full text @ Front. Neural Circuits
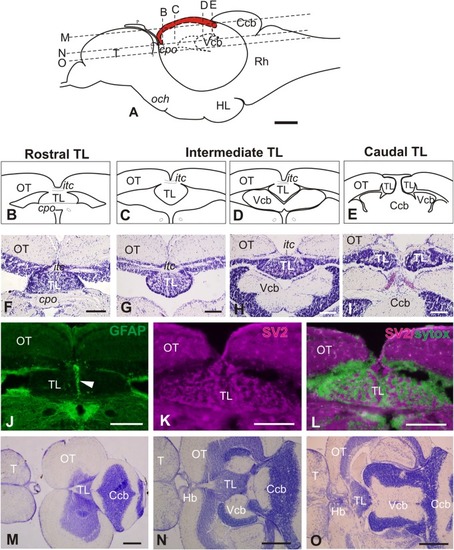
General morphology of the adult zebrafish Torus Longitudinalis (TL). |
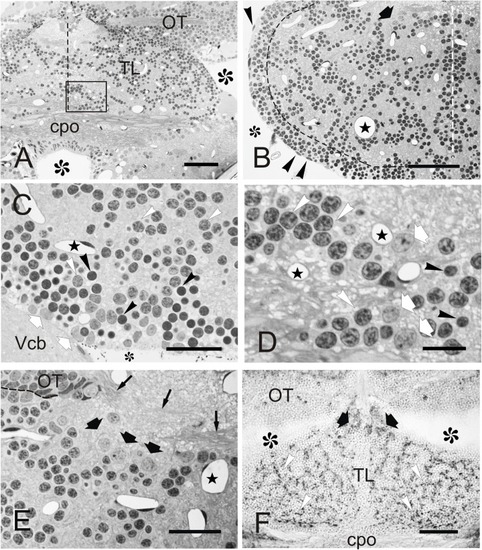
Cellular organization of zebrafish TL. |
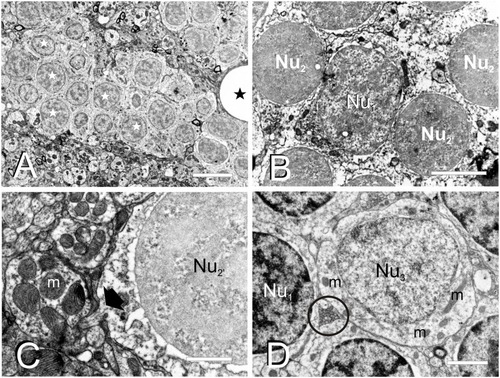
Fine cell structure of the adult TL. |
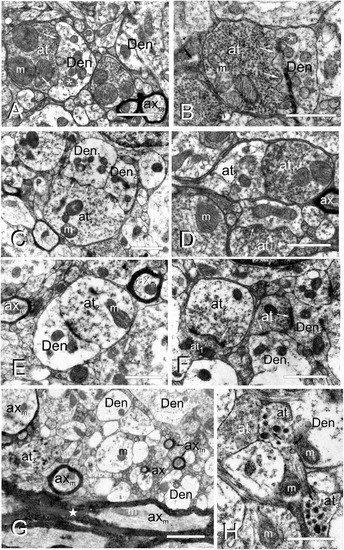
Fine cell processes structure of the adult TL. |
|

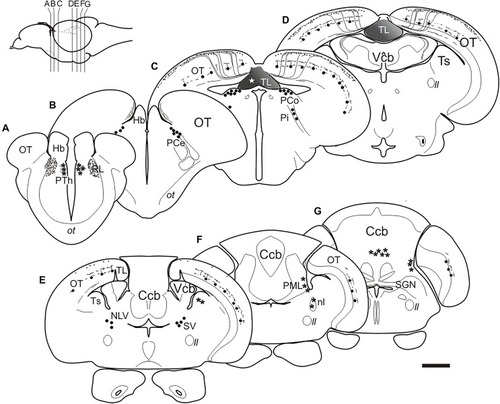
Labeled cells and fibers after direct DiI application to TL. |
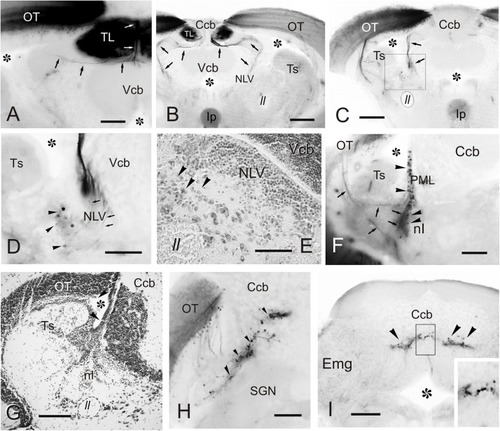
Labeled cells and fibers after direct DiI application to TL. Photomicrographs of transverse sections caudal to the tracer application point showing labeled structures observed after homolateral DiI application to intermediate TL. Ipsilateral side is to the left. |
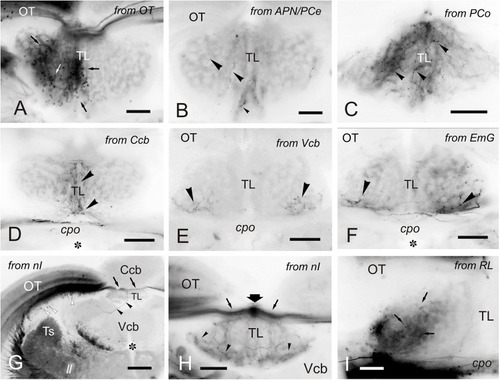
Labeled cells and fibers in TL after DiI application to various regions and nuclei. |
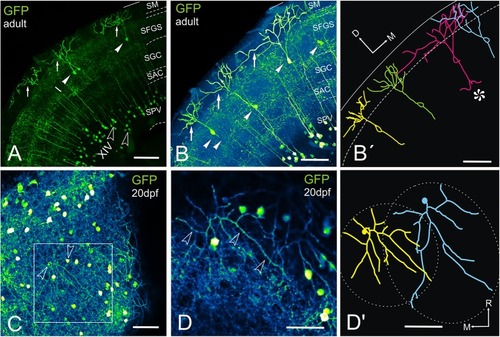
GFP + cells and fibers in the optic tectum of |
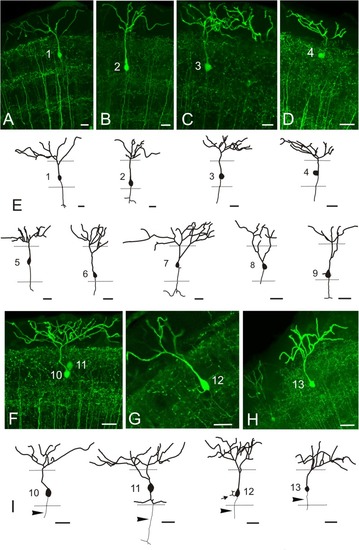
GFP + pyramidal cells in |

GFP + cells and fibers in |
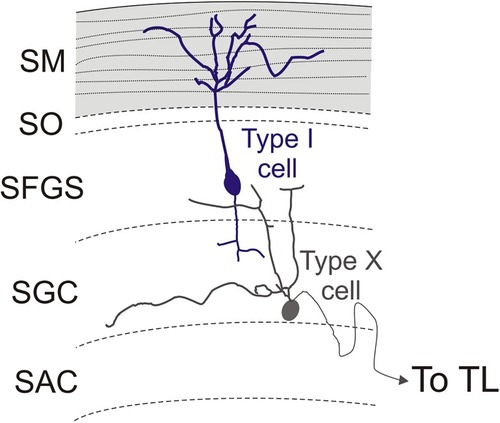
Schematic representation of type I and type X cells in the optic tectum. The stratum marginale is marked in gray. Parallel fibers are represented with dotted lines. Limit between layers in the optic tectum are marked with dashed lines. |