
- Title
-
A photoperiodic time measurement served by the biphasic expression of Cryptochrome1ab in the zebrafish eye
- Authors
- Okano, K., Saratani, Y., Tamasawa, A., Shoji, Y., Toda, R., Okano, T.
- Source
- Full text @ Sci. Rep.
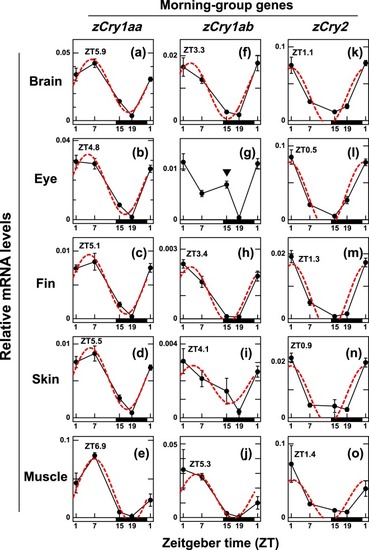
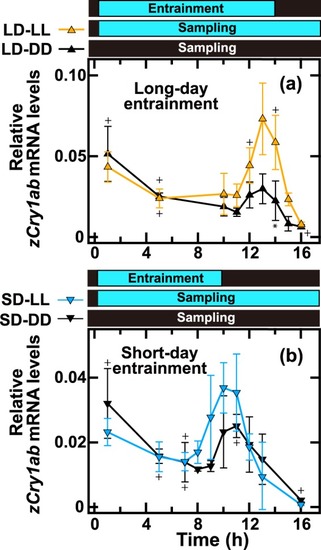
Daily profiles of |
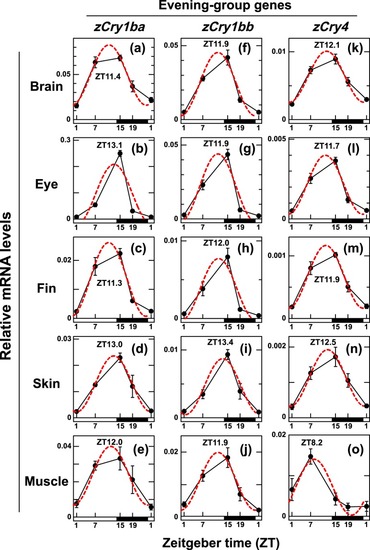
Daily profiles of |
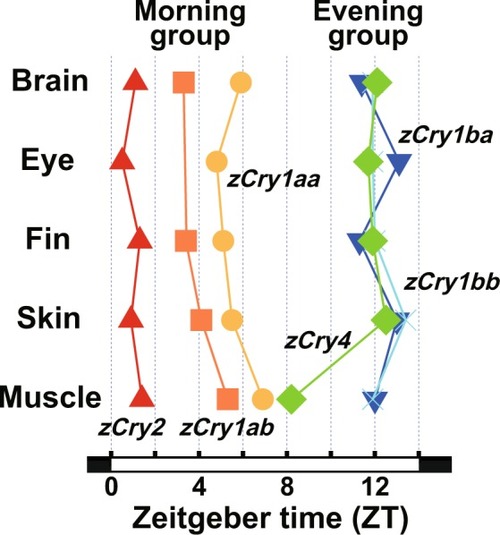
Maximum |

|

Daily profiles of |
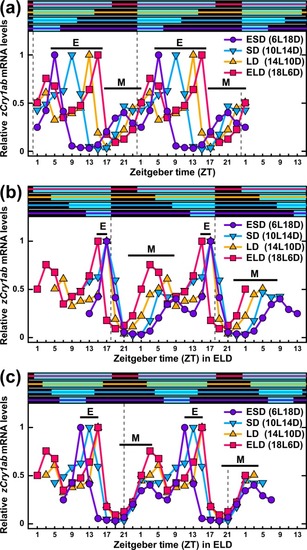
Double plots of 24-h profiles of relative |
|
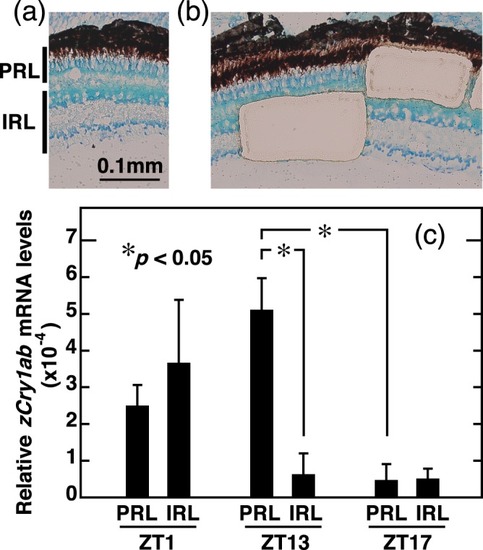
qRT-PCR analysis of |
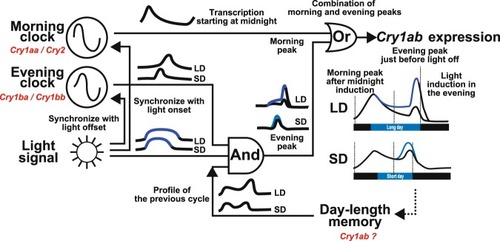
Model of a possible |