|
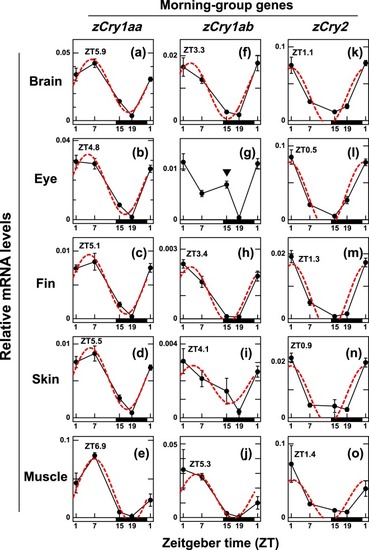
Daily profiles of zCry1aa, zCry1ab and zCry2 mRNA expression levels in central and peripheral tissues under white light/dark cycles. Each tissue was collected at ZT1, ZT7, ZT15 or ZT19 from zebrafish (n = 4) entrained to white light/dark cycles (14L:10D). Each mRNA level was estimated using zβ-actin as a reference gene because it was the most stably expressed in the examined tissues among the control genes. Data were analyzed by one-way ANOVA (Supplementary Table S1) and Tukey-Kramer post-hoc tests (Supplementary Tables S2–S31). Error bars represent ± SE. Peak times of cosine-fitting to the data as calculated by CircWave1.4 (red dashed curves; Supplementary Table S32) are shown. A down-pointing triangle in panel g denotes the sustained expression of zCry1ab transcripts at ZT15 in the eye.
|