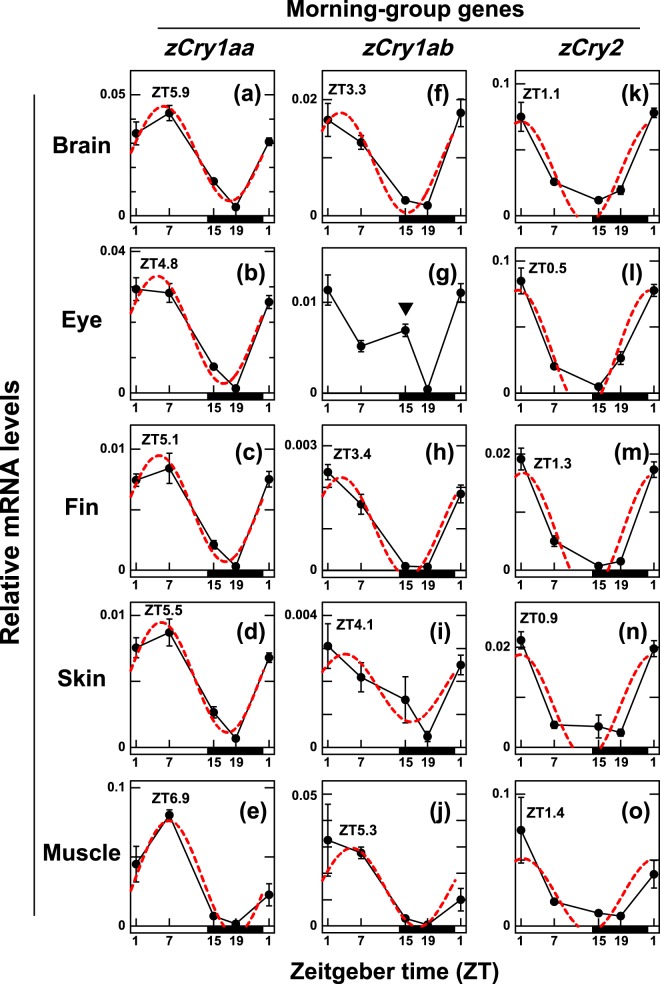
IMAGE

Figure 1

ID
ZDB-IMAGE-200406-55
Source
Figures for Okano et al., 2020
Image
Figure Caption

Figure 1

Daily profiles of zCry1aa, zCry1ab and zCry2 mRNA expression levels in central and peripheral tissues under white light/dark cycles. Each tissue was collected at ZT1, ZT7, ZT15 or ZT19 from zebrafish (n = 4) entrained to white light/dark cycles (14L:10D). Each mRNA level was estimated using zβ-actin as a reference gene because it was the most stably expressed in the examined tissues among the control genes. Data were analyzed by one-way ANOVA (Supplementary Table S1) and Tukey-Kramer post-hoc tests (Supplementary Tables S2S31). Error bars represent ± SE. Peak times of cosine-fitting to the data as calculated by CircWave1.4 (red dashed curves; Supplementary Table S32) are shown. A down-pointing triangle in panel g denotes the sustained expression of zCry1ab transcripts at ZT15 in the eye.

Acknowledgments
This image is the copyrighted work of the attributed author or publisher, and ZFIN has permission only to display this image to its users. Additional permissions should be obtained from the applicable author or publisher of the image. Full text @ Sci. Rep.