
- Title
-
BACH family members regulate angiogenesis and lymphangiogenesis by modulating VEGFC expression
- Authors
- Cohen, B., Tempelhof, H., Raz, T., Oren, R., Nicenboim, J., Bochner, F., Even, R., Jelinski, A., Eilam, R., Ben-Dor, S., Adaddi, Y., Golani, O., Lazar, S., Yaniv, K., Neeman, M.
- Source
- Full text @ Life Sci Alliance
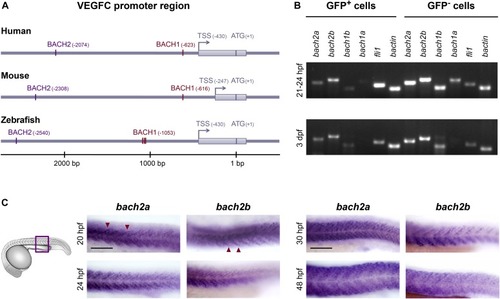
Spatial and temporal expression of bach2 paralog transcripts during zebrafish development. (A) BACH putative binding sites are evolutionarily conserved in the VEGFC promoter region. Numbering is from the ATG (translation initiation) because of the difference in length of the mouse’s 5′ UTR. An arrow indicates transcription start site (TSS), and the location of the first exon is marked as a gray rectangle. The location of the BACH sites is as predicted by Genomatix Genome Analyzer MatInspector: Human (NM_005429.5 TSS at hg19, chr4:177713899 on the minus strand); Mouse (NM_009506.2 TSS at mm9, chr8:54077532 on the plus strand); and Zebrafish (NM_205734.1 TSS at Zv9, chr1:39270725 on the minus strand). (B) Semi-quantitative RT-PCR analysis of the indicated genes (bactin-β actin) in enriched GFP+ cells isolated by FACS from Tg(fli1:EGFP)y1 embryos at two developmental time points, 21–24 hpf and 3 dpf (two independent experiments for each time point). (C) A lateral view of the trunk region of a wild-type zebrafish embryo at 20, 24, 30, and 48 hpf, detected with a specific bach2a or bach2banti-sense mRNA probe. A red arrowhead indicates somite boundaries. Scale bar, 100 μm.
EXPRESSION / LABELING:
|
bach2a is essential for developmental angiogenesis in zebrafish embryos. (A) Confocal images of the primordial hindbrain channel (PHBC, white arrow) of 30-hpf Tg(fli1:EGFP)y1 embryos injected with control MO (10 ng), bach2a MO (3.75 ng), bach2b MO (3.75 ng), bach2b gRNA (125 ng), or vegfcMO (10 ng). Asterisk indicates the absence of PHBC. (B) Percentage of 30-hpf Tg(fli1:EGFP)y1 embryos with intact PHBC formation after injection with control MO (10 ng, nControl MO = 68), bach2a MO (3.75 ng, nbach2a MO = 107; *P< 0.0001), bach2b MO (3.75 ng, nbach2b MO = 48), bach2b gRNA (125 ng, nbach2bgRNA = 42), or vegfc MO (10 ng, nvegfc MO = 35; *P < 0.0001). Error bars, mean ± SEM. (C) Percentage of 30-hpf Tg(fli1:EGFP)y1 embryos with intact PHBC formation after injection with control MO (10 ng, nControl MO = 24) or an increased concentration of bach2b MO (5 ng, nbach2b MO 5ng = 24) or (10 ng, nbach2b MO 10ng = 24). Error bars, mean ± SEM; P > 0.99999. (D) Confocal projection at 30 hpf Tg(fli1:EGFP)y1 of homozygous bach2a mutants (bach2amut−/−) from F2 bach2amut+/− incross. White arrow points at an intact PHBC detected in embryos injected with control MO (10 ng, bach2amut−/− + Control MO) and bach2a MO (3.75 ng, bach2amut−/− + bach2a MO). Asterisk indicates defects in PHBC development after injection with bach2b MO (3.75 ng, bach2amut−/− + bach2b MO) or bach2b gRNA (125 ng, bach2amut−/− + bach2b gRNA). Scale bar, 100 μm. (E) Percentage of randomly selected bach2a+/− F2 incross progeny at 30 hpf with an intact PHBC formation injected with control MO (10 ng, nbach2amut + Control MO = 50; P > 0.99999), bach2a MO (3.75 ng, nbach2amut + bach2a MO = 75; *P < 0.0002), bach2b MO (3.75 ng, nbach2amut + bach2a MO = 55; *P < 0.012) or bach2b gRNA (125 ng, nbach2amut + bach2b gRNA = 137; *P < 0.001). After genotyping, offspring followed the expected Mendelian ratios of inheritance. Error bars, mean ± SEM. Kruskal–Wallis test in panels (B, C, E). EXPRESSION / LABELING:
PHENOTYPE:
|
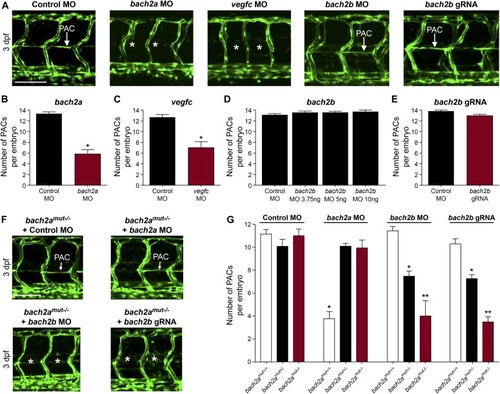
bach2a is essential for parachordal cell (PAC) development in zebrafish embryos. (A, B) Confocal projection of the trunk of 3-dpf Tg(fli1:EGFP)y1 embryos showing PACs (white arrow) in control MO, bach2b, or bach2b gRNA-injected embryos but not after injection with bach2a or vegfc MO (white asterisk). Scale bar, 100 μm. (B) Number of PAC-containing segments (mean ± SEM) in 3-dpf Tg(fli1:EGFP)y1 zebrafish embryos injected with control MO (10 ng) or bach2a MO (3.75 ng, nControl MO = 46; bach2a MO, nbach2a MO = 53; *P < 0.001). Error bars, mean ± SEM. (C) Number of PAC-containing segments in vegfc MO-injected morphants (10 ng, nControl MO = 53, nvegfc MO= 41; *P < 0.0001). Error bars, mean ± SEM. (D) Number of PAC-containing segments in 3-dpf Tg(fli1:EGFP)y1 zebrafish embryos injected with indicated bach2b MO concentrations (3.75, 5, or 10 ng, nControl MO = 18; nbach2b MO-3.75ng= 30; nbach2b MO-5ng = 30; nbach2b MO-10ng = 10; P ≥ 0.2819). Error bars, mean ± SEM. (E) Quantification of PAC-containing segments in embryos injected with bach2b gRNA (125 ng, nControl MO = 35 nbach2b gRNA = 42; P = 0.0615). Error bars, mean ± SEM. (F) Confocal projection of the trunk region showing PAC-containing segments in Tg(fli1:EGFP)y1-homozygous bach2a mutants (bach2amut−/−) from F2 bach2amut+/− incross. An asterisk indicates the absence of PACs in bach2amut−/− embryos injected with bach2b MO (bach2amut−/− + bach2b MO) or bach2b gRNA (bach2amut−/− + bach2b gRNA) and a white arrow, their presence. Scale bar, 100 μm. (G) Number of PAC-containing segments (mean ± SEM) in 3-dpf embryos randomly selected from bach2a+/− F2 incross progeny injected with control MO (10 ng, nbach2amut + Control MO = 50; P = 0.5514), bach2a MO (3.75 ng, nbach2amut + bach2aMO = 75; *P < 0.0001), bach2b MO (3.75 ng, nbach2amut + bach2b MO = 55; *P and **P < 0.0222), or bach2b gRNA (125 ng, nbach2amut + bach2b gRNA = 137; *P and **P < 0.0001). After genotyping, offspring followed the expected Mendelian ratios of inheritance. (B, C, D, E, G) Wilcoxon rank sum test in panels (B, C, E) and Kruskal–Wallis test in panels (D, G).
EXPRESSION / LABELING:
PHENOTYPE:
|

bach2a is necessary for thoracic duct (TD) development in zebrafish larvae. (A) Confocal images of the TD in 4-dpf control MO- (10 ng), bach2a MO-(3.75 ng), vegfc MO- (10 ng), bach2b MO- (10 ng), or bach2a gRNA-injected Tg(fli1:EGFP)y1 larvae. A white arrow indicates the presence of a TD and a white asterisk, its absence. Scale bar, 20 μm. (B) Percentage of 4-dpf Tg(fli1:EGFP)y1 larvae with an intact TD after injection with control MO (10 ng) or bach2a MO (3.75 ng, nControl MO = 46; nbach2a MO = 52). Error bars, mean ± SEM; *P < 0.0001. (C) Percentage of larvae with a TD after injection with vegfc MO (10 ng, nControl MO = 46; nvegfc MO = 52). Error bars, mean ± SEM; *P < 0.0001. (D) Quantification of bach2b morphants with an intact TD after injection with indicated bach2b MO concentrations (3.75, 5, or 10 ng, nControl MO = 18; nbach2b MO-3.75ng = 30; nbach2b MO-5ng = 30; and nbach2b MO-10ng = 10; P ≥ 0.1356). Error bars, mean ± SEM. (E) Percentage of TD-containing larvae injected with bach2b gRNA (125 ng, nControl MO = 35 nbach2b gRNA = 42; P = 0.5461). Error bars, mean ± SEM. (F) Confocal images of a TD (white arrow) in 4-dpf Tg(fli1:EGFP)y1: homozygous bach2a mutants (bach2amut−/−) derived from bach2amut+/− F2 incross. An asterisk indicates absence of a TD and a white arrow, its presence. Scale bar, 20 μm. (G) Analysis of Tg(fli1:EGFP)y1 4-dpf progeny obtained from F2 bach2a heterozygous intercross. Random selection from the pool of siblings injected at the one-cell stage with control MO (10 ng, nbachmut + Control MO = 50), bach2a MO (3.75 ng, nbach2amut + bach2a MO = 75), bach2b MO (3.75 ng, nbach2amut + bach2b MO = 55), or bach2bgRNA (125 ng, nbach2amut + bach2b gRNA = 137) was found to maintain, after genotyping, the expected Mendelian ratios of inheritance. Error bars, mean ± SEM; *P < 0.0003. (B, C, D, E, G) Wilcoxon rank sum test in panels (B, C, E) and Kruskal–Wallis test in panels (D, G). EXPRESSION / LABELING:
PHENOTYPE:
|

BACH1 and VEGFC genetically interact. (A) Conservation of BACH sites in human, mouse, and zebrafish. The distal site is completely conserved. The proximal site is fully conserved between mouse and human, whereas there are three BACH sites at very close proximity in zebrafish. All proximal sites differ by one nucleotide from the consensus sequence. (B) Chromatin immunoprecipitation assay, followed by PCR measurements, was performed using primer mapping to the above human BACH proximal and distal regulatory sites and DNA precipitated with nonspecific IgG, HA-tag, or BACH1 antibodies. (C) Schematic representation of the wild-type human VEGFC promoter-driven luciferase (Luc) reporters (blue) (pVEGFCwt-Luc) and of three constructs deleted either from proximal (nt. −623 to −603, pVEGFCΔPro-Luc) or distal (nt. −2074 to −2054, pVEGFCΔDis-Luc) BACH-binding sites or a combination thereof (nt −623 to −603 and −2074 to −2054, pVEGFCΔProDis-Luc). Numbers refer to the nucleotide positions relative to ATG (translation initiation). (D)Quantification of dual–luciferase activity in human ES2 cells driven from pVEGFCwt-Luc, pVEGFCΔPro-Luc, pVEGFCΔDis-Luc, and pVEGFCΔProDis-Luc constructs. Relative luciferase activity is shown as a percentage of the pVEGFCwt-Luc value (mean ± SEM, n = 3). *P < 0.0001, Kruskal–Wallis test. (E) Immunofluorescence staining of human ES2 cells stably expressing either an empty pIRES vector (Control) or N-terminally HA-tagged BACH1 (BACH1) with antibodies directed against the HA tag (red, left panel) or against VEGFC (red, right panel). Nuclei were counterstained with DAPI (blue). Scale bar, 20 μm. TSS, transcription start site.
|
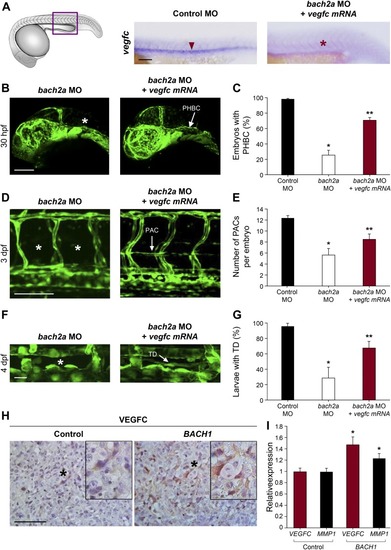
BACH mediates angiogenesis and lymphangiogenesis in a VEGFC-dependent manner. (A) Whole-mount in situ hybridization of 24-hpf, wild-type zebrafish embryos demonstrating the expression of vegfc mRNA after injection with control MO (Control MO 10 ng, red arrowhead) and the absence of its expression in embryos injected with specific MO targeting bach2a (3.75 ng, bach2a MO, red asterisk). Scale bar, 100 μm. (B) Confocal images of 30-hpf Tg(fli1:EGFP)y1 embryos co-injected with specific MOs targeting bach2a (3.75 ng) and in vitro–transcribed vegfc mRNA (800 pg, bach2a MO + vegfcmRNA) demonstrating the restoration of PHBC (white arrow). (C)Percentage of rescued PHBC defects in 30-hpf Tg(fli1:EGFP)y1 embryos after co-injection with bach2a MO (3.75 ng) and vegfc mRNA (800 pg, nControl MO = 56; nbach2a MO = 58; nbach2a MO + vegfc mRNA = 56). Error bars, mean ± SEM; * or **P < 0.0001. (D) Rescue of parachordal cell (PAC) development in 3-dpf Tg(fli1:EGFP)y1 embryos after the co-injection of bach2a MO and vegfcmRNA (bach2a MO + vegfc mRNA; PACs are indicated by a white arrow). Scale bar, 100 μm. (E) Quantification of the number of PAC-containing segments (mean ± SEM) in 3-dpf Tg(fli1:EGFP)y1 embryos after the co-injection of bach2a MO (3.75 ng) and vegfc mRNA (nControl MO = 47; nbach2a MO= 27; nbach2a MO + vegfc mRNA = 54; * or **P < 0.01). (F) Thoracic duct (TD) formation in 4-dpf Tg(fli1:EGFP)y1 embryos co-injected with bach2a MO and vegfc mRNA (bach2a MO + vegfc mRNA; TD is indicated by a white arrow). Scale bar, 20 μm. (G) Percentage of 4-dpf Tg(fli1:EGFP)y1 embryos showing normal TD after bach2a MO and vegfc mRNA injection (bach2a MO + vegfcmRNA). (nControl MO-10ng = 32; nbach2a MO = 65; nbach2a MO + vegfc mRNA = 68 (Error bars, mean ± SEM; * or **P < 0.01. (H) Immunohistochemistry labeling of control (Control) or BACH1 (BACH1) ectopically expressing ES2 ovarian carcinoma xenograft specimens using anti-VEGFC antibodies and counterstaining with hematoxylin (blue). Black asterisk localizes the region magnified in the black frame. Scale bar, 100 μm. (I) Quantitative RT-PCR measurement of VEGFC and MMP1 mRNA expression in xenograft initiated either from control or BACH1-overexpressing ES2 cells (n = 5 in each group; mean ± SEM; *P < 0.05. (C, E, G, I) Kruskal–Wallis test in panels (C, E, G) and Wilcoxon rank sum test in panel (I). |
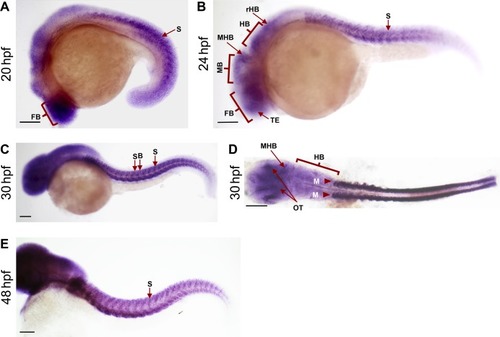
Expression of bach2a at different stages during zebrafish development. (A, B, C, D, E) Embryos at 20 (A), 24 (B), 30 (C, D), and 48 (E) hpf were examined by whole-mount in situ hybridization with an antisense bach2ariboprobe. Abbreviations: FB, forebrain; HB, hindbrain; M, myotomes; MB, midbrain; MHB, midbrain hindbrain boundary; OT, optic tectum; rHB, rostral hindbrain; S, somite; SB, somite-boundaries; TE, telencephalon. Scale bar, 500 μm. |
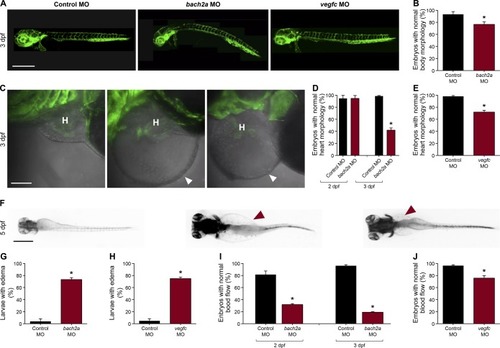
Knockdown of bach2a causes morphological defects in zebrafish embryos. (A) Lateral-view confocal micrographs of full-body, 3-dpf Tg(fli1:EGFP)y1zebrafish embryos after injection with control (10 ng, Control MO), bach2a(3.75 ng, bach2a MO), or vegfc (10 ng, vegfc MO) morpholino oligonucleotide, showing body curvature of bach2a morphants. Scale bar, 500 μm. (B) Percentage of 3-dpf Tg(fli1:EGFP)y1 zebrafish embryos with a normal morphology (no body curvature) after injection with control (10 ng, Control MO) or bach2a MO (3.75 ng, nControl MO = 46; nbach2a MO = 47 *P ≤ 0.0005). (C) Confocal images of the heart morphology of 3-dpf Tg(fli1:EGFP)y1 zebrafish embryos after injection with control, bach2a, or vegfc MO. H marks the heart and a white arrowhead, a pericardial edema. Scale bar, 500 μm. (D) Quantification of 2- and 3-dpf Tg(fli1:EGFP)y1zebrafish embryos with a normal heart morphology after injection with control MO (10 ng, Control MO) or bach2a MO (3.75 ng, 2 dpf: nControl MO = 16; nbach2a MO = 19; 3 dpf: nControl MO = 47; nbach2a MO = 58; *P < 0.0001). (E)Percentage of 3-dpf Tg(fli1:EGFP)y1 zebrafish embryos with a normal heart morphology after injection with control MO (10 ng) or vegfc MO (10 ng, nControl MO = 54; nvegfc MO = 41; *P < 0.0001). (F) Dorsal view of 5-dpf Tg(fli1:EGFP)y1 zebrafish larvae after injection with control MO, bach2a MO, or vegfc MO. Red arrowhead indicates edema. Scale bar, 100 μm. (G)Percentage of 5-dpf Tg(fli1:EGFP)y1 zebrafish larvae with edema after injection with control MO (10 ng) or bach2a MO (3.75 ng, nControl MO-10ng = 22; nbach2a MO = 28; *P < 0.05). (H) Quantification of 5-dpf Tg(fli1:EGFP)y1zebrafish larvae with edema after injection with control MO (10 ng) or vegfc MO (10 ng, nControl MO = 22; nvegfc MO = 53; *P < 0.0001). (I) Percentage of 2- and 3-dpf Tg(fli1:EGFP)y1 zebrafish embryos with a normal blood flow rate after injection with control MO (10 ng) or bach2a MO (3.75, 2 dpf: nControl MO = 14; nbach2a MO = 19; 3 dpf: nControl MO = 47; nbach2a MO = 58; *P < 0.05). (J) Percentage of 3-dpf Tg(fli1:EGFP)y1 zebrafish embryos with a normal blood flow rate after injection with control MO (10 ng) or vegfc MO (10 ng: nControl MO = 54; nvegfc MO = 41; *P < 0.004). (B, D, E, G, H, I, J) Wilcoxon rank sum test in panels (B, D, E, G, H, I, J). |
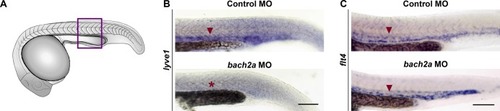
Expression of lyve1 is impaired in bach2a morphants. (A) Drawing of zebrafish embryo. (B, C) Purple box indicates region imaged in panels (B, C). (B) Whole-mount in situ hybridization comparing the expression pattern (red arrowhead) of lyve1 in 24-hpf wild-type zebrafish embryos after injection with control or bach2a MO (red asterisk indicates absence of expression). (C) Whole-mount in situ hybridization using flt4riboprobe of 24-hpf, wild-type zebrafish embryos after injection with control or bach2a MO. Scale bar, 100 μm. |
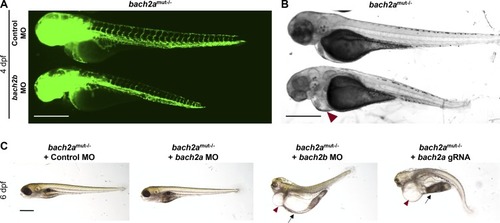
Morphological abnormalities in homozygous bach2a mutants after bach2b knockdown. (A) Fluorescent images of homozygous bach2a (bach2amut−/−) siblings obtained from F2 bach2a heterozygous intercross injected at the one-cell stage with control (10 ng, Control MO) or bach2b MO (3.75 ng). Scale bar, 500 μm. (A, B) Bright-field images corresponding to the larvae presented in panel (A). Red arrowhead indicates cardiac edema. Scale bar, 500 μm. (C)Lateral view of 6-dpf homozygous bach2a (bach2amut−/−) siblings obtained from F2 bach2a heterozygous intercross injected with control (10 ng, Control MO), bach2a (3.75 ng, bach2a MO), bach2b (3.75 ng, bach2b MO) morpholino, or bach2b gRNA (125 ng, bach2b gRNA). Red arrowhead indicates cardiac edema, whereas body edema is indicated by a black arrow. Scale bar, 500 μm. |

vegfc mRNA levels are not affected in bach2b morphants. Whole-mount in situ hybridization presenting the expressions of vegfc in 24-hpf embryos injected with control or bach2b MO. Presence of expression is indicated by a red arrowhead. Scale bar, 100 μm. EXPRESSION / LABELING:
|