FIGURE SUMMARY
Title

The extracytoplasmic function sigma factor σVreI is active during infection and contributes to phosphate starvation-induced virulence of Pseudomonas aeruginosa

Authors
Otero-Asman, J.R., Quesada, J.M., Jim, K.K., Ocampo-Sosa, A., Civantos, C., Bitter, W., Llamas, M.A.
Source
Full text @ Sci. Rep.

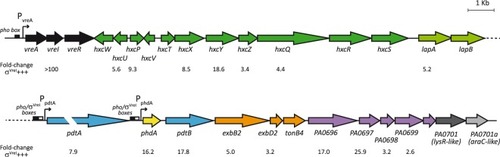
Genetic organization of the σVreI regulon. Transcriptional organization of the vreAIR locus (black) and the downstream σVreI-regulated genes (colored). Block arrows represent the different genes, their relative sizes, and their transcriptional orientation, with the name of the gene or the PA number (http://www.pseudomonas.com/) indicated below the arrow. The promoters and regulatory boxes identified within this locus are indicated19,20,62. Numbers indicate the fold-change in the expression of the gene in cells overproducing σVreI as determined earlier by microarray21. The hxc genes (dark green) encode a type II secretion system involved in the secretion of the low molecular weight alkaline phosphatase LapA (light green)62. pdtA and pdtB (blue) encode a functional two-partner secretion (TPS) system involved in P. aeruginosa virulence in the C. elegans model63. phdA (yellow) encodes a homologue of the prevent-host-death (Phd) protein family and is required for biofilm formation and eDNA release64. exbB2-exbD2-tonB4 genes (orange) encode a still uncharacterized putative TonB system. The function of the PA0696-PA0700 gene products (purple) is still unknown. PA0701 (dark grey) encodes a putative LysR-like transcriptional regulator and PA0701a (light grey), which is not annotated in the PAO1 genome but it is in the P. aeruginosa PA14 genome, encodes a putative AraC-like transcriptional regulator.

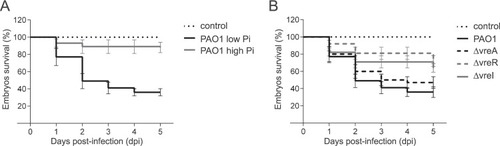
Survival of zebrafish embryos upon infection with P. aeruginosa. One day post-fertilization embryos were injected with ∼1000 CFU of the P. aeruginosa PAO1 wild-type strain grown either in Pi-restricted or Pi-sufficient conditions (A) or with the indicated PAO1 isogenic mutant grown under Pi starvation (B). Uninfected control (non-injected) is shown. Data represents the mean ± SD of four biologically independent replicates (N = 4) with 20 embryos/group in each replicate. P-values were calculated by log-rank (Mantel-Cox) test.

P. aeruginosa infections in the A549 cell line. (A) A549 cell viability. The P. aeruginosa PAO1 wild-type strain and the indicated isogenic mutant were grown in Pi-restricted (−) or Pi-sufficient (+) conditions prior to infection. Formazan production upon addition of the MTT tretazolium salt was determined spectrophotometrically at 620 nm. Uninfected cells (white bar) were used as control. (B) P. aeruginosa internalization into A549 cells. A549 cells were infected with the indicated P. aeruginosa strain previously grown in Pi-restricted conditions. Internalization is reported as the ratio between bacteria CFU inside (in) the A549 cells and CFU in the culture supernatant (out). In both panels data are means ± SD from three biological replicates (N = 3). P-values were calculated by unpaired two-tailed t-test as described in Materials and Methods and brackets indicate the comparison to which the P-value applies.

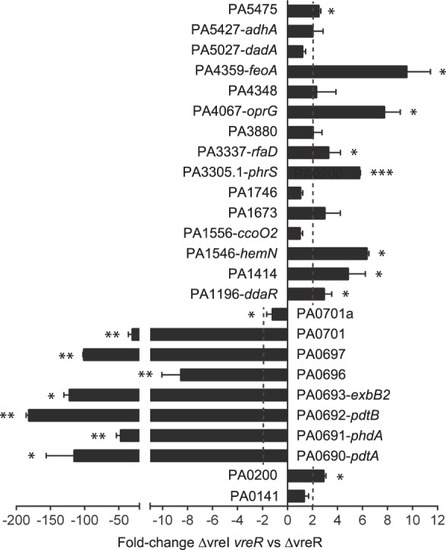
Differential gene expression in the P. aeruginosa ΔvreR and ΔvreI vreR mutants. mRNA levels of the indicated genes were obtained by qRT-PCR upon growth of the P. aeruginosa mutants in low Pi medium. The 2−ΔΔCT method was used to determine the fold-change range in gene expression in ΔvreI vreR versus ΔvreR. Data are means ± SD from three biological replicates (N = 3) each one including three technical replicates. P-values were calculated by one-sample t-test to a hypothetical value of 1 as described in Materials and Methods.

σVreI activation during P. aeruginosa infection in zebrafish embryos. (A) Dorsal view of the head of a two days post-fertilization zebrafish embryo. The hindbrain ventricle where P. aeruginosa was injected is highlighted. (B) Confocal images of the head of embryos injected in the hindbrain ventricle with ∼2000 CFU of the P. aeruginosa PAO1 wild-type strain or its isogenic ΔvreI mutant bearing the σVreI-dependent pdtA::rfp transcriptional fusion (pMP0690mCherry plasmid, Table S1) (red channel) at 0 and 12 hpi. P. aeruginosa was grown in high Pi medium prior injection. Neutrophils expressing constitutively a green fluorescence protein (gfp) are also visualized (green channel). Images are representative of three independent experiments (N = 3).

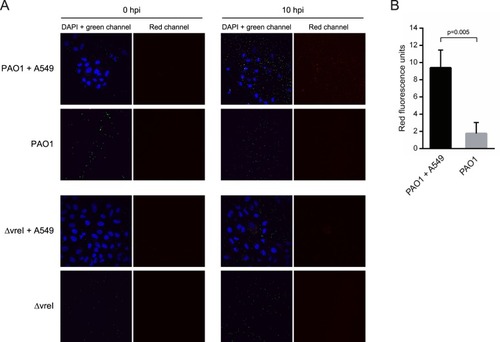
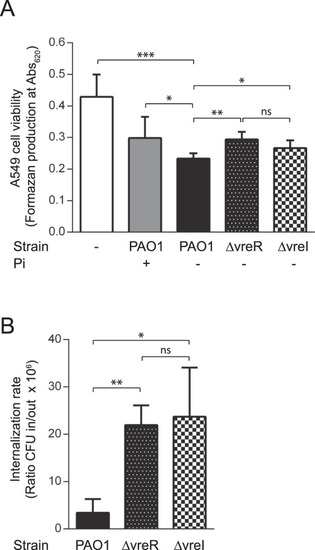
Activation of σVreI upon interaction of
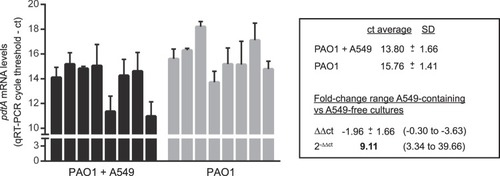
 P. aeruginosa with A549 eukaryotic cells. (A) Confocal images of P. aeruginosa-A549 co-cultures at 0 and 10 hpi. P. aeruginosa PAO1 wild-type strain and its isogenic ∆vreI mutant expressing a green fluorescent protein (gfp) constitutively (from the pBBRmEos3.1 plasmid, Table S1) (green channel) and containing the σVreI-dependent pdtA::rfp transcriptional fusion (pMP0690mCherry plasmid, Table S1) (red channel) were grown in high Pi medium and inoculated in A549-containing and A549-free cultures. A549 cells DNA was stained with DAPI (blue channel). Images are representative of three independent experiments (N = 3). (B) Quantification of the red fluorescence intensity observed in (A) was performed as described in Materials and Methods, and the total corrected cellular fluorescence (TCCF) is given. Data are means ± SD from three biological replicates (N = 3). P-value was calculated by unpaired two-tailed t-test.

pdtA mRNA levels upon P. aeruginosa interaction with A549 cells. The P. aeruginosa PAO1 wild-type strain was grown in high Pi medium and inoculated in A549-containing and A549-free cultures. At 3 hpi, total RNA was extracted and pdtA mRNA levels determined by qRT-PCR. Data plotted are the result of eight biologically independent replicates, each bar representing means ± SD of the three technical replicates performed on each biological replicate. The cycle threshold (ct) average and the standard deviation (SD) of each condition is indicated. The 2−ΔΔCT method was used to determine the fold-change range in pdtA expression in A549-containing versus A549-free cultures. The fold-change range taking into account the SD is shown between brackets.

Acknowledgments
This image is the copyrighted work of the attributed author or publisher, and ZFIN has permission only to display this image to its users. Additional permissions should be obtained from the applicable author or publisher of the image. Full text @ Sci. Rep.