
Figure 7
- ID
- ZDB-IMAGE-200302-52
- Publication
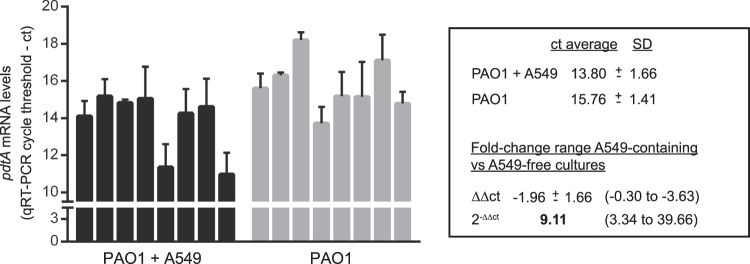
- Otero-Asman et al., 2020 - The extracytoplasmic function sigma factor σVreI is active during infection and contributes to phosphate starvation-induced virulence of Pseudomonas aeruginosa
- All Figures
- Figures for Otero-Asman et al., 2020
|
Figure 7