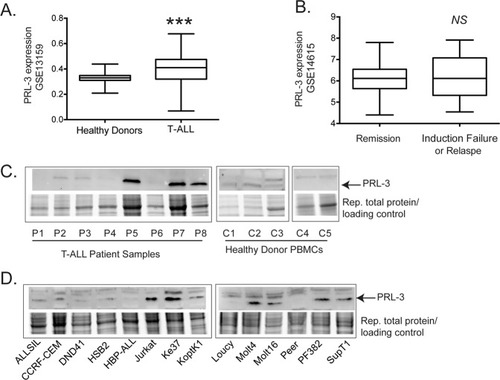
PRL-3 is highly expressed in a majority of human T-ALL.

a Microarray expression analysis of GSE13159 comparing bone marrow samples from healthy donors (n = 72) and T-ALL patients (n = 174), ***p = 6.8e−10. b Analysis of GSE14615 comparing PRL-3 expression between bone marrow samples from T-ALL patients achieving remission and patients with induction failure. NS = not significant. Representative western blot analysis of (c) primary patient T-ALL and PBMCs, and (d) human T-ALL cell lines, showing PRL-3 expression. The total protein loaded in each sample was used as loading control instead of housekeeping protein, with a band of ~50 kD chosen as a representative image in the figure.

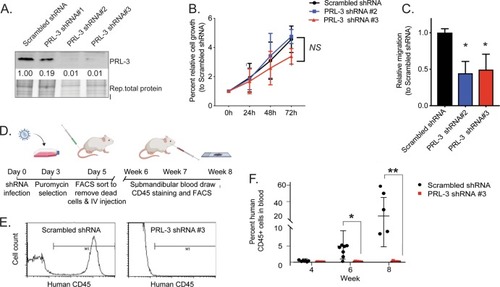
PRL-3 knock-down inhibits cell migration and T-ALL engraftment in a xenograft mouse model.

a Representative western blot analysis figure showing PRL-3 protein expression in Jurkat T-ALL cells 4d post-infection with lentivirus carrying shRNA. Numbers represent relative expression of PRL-3 protein, normalized to total protein loaded and compared to scrambled (SCR) control. b Cells infected with SCR or PRL-3 knock-down shRNA were cultured in media 4 days post-infection with 5 μg/ml puromycin for 72 additional hours. Cell growth was determined by Cell Titer-Glo assay and normalized to the readout of day 0, and shows no difference between groups. Data shown are the average of three independent experiments, done in triplicate, NS = not significant. c Knock-down of PRL-3 in Jurkat cell line reduced migration towards a serum stimulus more than 50%. Migration was normalized to the cells infected by SCR shRNA, p < 0.05 compared to SCR control, *p < 0.05. d Schematic diagram of the xenotransplantation assay. e Representative flow cytometry analysis of submandibular blood sample after human CD45 staining. f Quantification of human CD45 staining of blood from mice at week 4,6, and 8 after transplantation. Each dot represents one mouse, the horizontal line represents the mean value, and the standard deviation is shown, *p < 0.01 and **p < 0.001 compared to shRNA control xenografted mice.

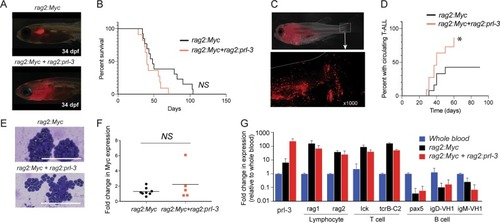
PRL-3 enhances circulation of leukemia cells in a zebrafish T-ALL model.

a Representative images of transient transgenic zebrafish expressing rag2:Myc+rag2:mCherry (n = 11) or rag2:Myc+rag2:mCherry+rag2:prl-3 (n = 6) at 34 days post-fertilization (dpf). b Kaplan–Meier analysis of time (days) percent survival (>70% of animal is mCherry-positive). c Representative rag2:Myc+rag2:mCherry+rag2:prl-3 animal, showing circulating mCherry + leukemia cells within the tail fin. d Kaplan–Meier analysis of time (days) for each T-ALL to be visualized in circulation, * p = 0.049. e Representative images of May-Gunwald Giemsa staining of blood samples from fish from each leukemia type. Scale bar = 100 μm. f Realtime RT-PCR analysis of Myc expression between rag2:Myc+rag2:mCherry (n = 8) and rag2:Myc+rag2:mCherry+rag2:prl-3 (n = 5). Each point represents one fish sample. NS = not significant. g Realtime RT-PCR analysis of lymphocyte, T-cell, and B-cell specific genes. Bars are the average expression of three samples per group.

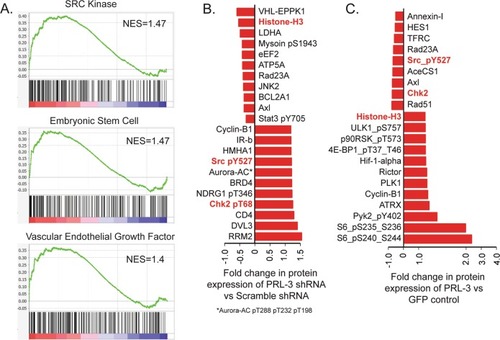
Src is a target of PRL-3.

a GSEA analysis of T-ALL patients samples (GSE13159) comparing bone marrow with high PRL-3 expression (upper quartile) vs low PRL-3 expression (bottom quartile), showing the normalized enrichement score (NES). Reverse-phase protein array analysis (RPPA) of (b) PRL-3 knock-down or (c) overexpression of PRL-3 in Jurkat cells showed differential protein expression when compared to controls. Red bars show any protein that was up or down regulated 20%, and protein names shown in red are common in both groups, and include Chk2, Histone H3, and Src_pY527.

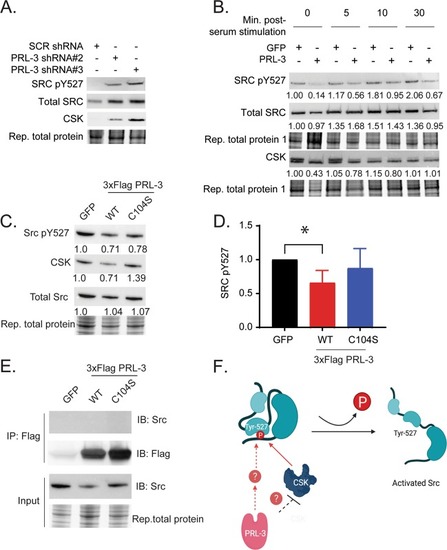
PRL-3 modulates Src phosphorylation.

a Representative western blot analysis of Src_pY527, total Src, and CSK in Jurkat cells with PRL-3 knock-down. b Western blot validation of Src pathway in PRL-3 overexpressing Jurkat cells. Cells were serum starved overnight and added to serum containing complete media for the indicated time points. Numbers shown represent relative protein expression. c Representative western blot validation of Src pathway in 3xFlag PRL-3 Wt and 3xFlag PRL-3 C104S mutant Jurkat cells. d Quantification of n = 4 independent experiments analyzing SRC_pY527, *p = 0.003. e Co-immunoprecipitation assay of Jurkat overexpressing PRL-3 substrate trapping mutants, 3xFlag PRL-3 C104S or 3xFlag PRL-3 C104D, did not pulldown Src. f Schematic of PRL-3 and modulation of Src pathway in T-ALL cells.

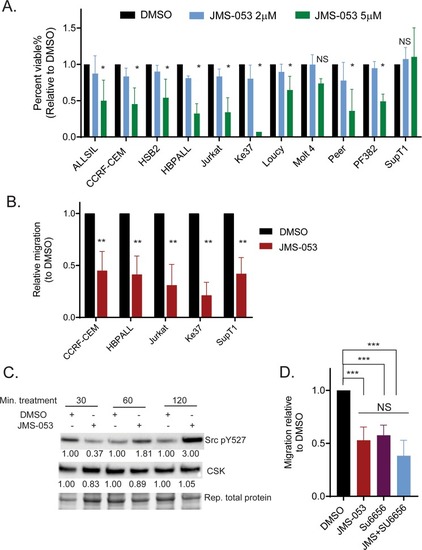
The PRL inhibitor JMS-053 reduces Src pathway activation and inhibits T-ALL migration.

a JMS-053 reduced cell viability in T-ALL cell lines with high PRL-3 expression, evaluated by quantifying ATP production via Cell-Titer Glo, *p ≤ 0.001 or NS = not significant, compared to DMSO. b JMS-053 treatment (10 μM) for 2 h suppressed cell migration of T-ALL cells, **p < 0.001 compared to DMSO. For all, bars are the average of three experiments, each done in triplicate, ± standard deviation. c JMS-053 (10 µM) treatment increased Src phosphorylation at tyrosine 527. Blots are representative of at least three independent experiments. The numbers in the blot are relative expression normalized to total protein loaded. d Cell migration capability of PRL-3 overexpressing cells was compared between groups treated with DMSO, Src inhibitor Su6656 (2.5 μM), JMS-053 (10 μM) or in combination and showed no additive effects between Su6656 and JMS-053, NS = not significant, ***p < 0.05.

Acknowledgments
This image is the copyrighted work of the attributed author or publisher, and ZFIN has permission only to display this image to its users. Additional permissions should be obtained from the applicable author or publisher of the image. Full text @ Oncogenesis