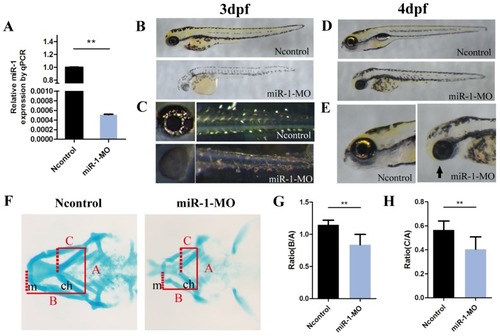
Knockdown of miR-1 affects neural crest derivatives. (A) qPCR showed that miR-1 MO knocked down miR-1 efficiently (the experiments were repeated three times). Data are expressed as the mean ± SD, from at least three independent experiments, n=15, **P < 0.01. (B, C) Lateral views of live zebrafish embryos showed pigment cells at 3 dpf. Negative control-injected zebrafish exhibited neural crest-derived pigment cells: black melanophores and iridescent iridophores. The distribution and number of melanophores were reduced in miR-1 morphants. The number of iridophores was reduced in the eye and trunk. (D, E) Lateral views of embryos at 4 dpf. miR-1 morphants displayed a shorter body length with a smaller head and edema around the heart. The lower jaw was reduced in size in the miR-1 morphants (arrows) compared with the negative control embryos. (F) Alcian blue staining showed cartilage development at 4 dpf; ventral views of embryos. (G, H) Ratios B: A and C: A, as shown in (F), in the miR-1 MO-injected and negative MO-injected groups. The definition for lines A, B, and C has been described previously. microRNA-1, miR-1; morpholino, MO; dpf, days post fertilization; mc, Meckel's cartilage; pq, palatoquadrate; ch, ceratohyal cartilage; Data are expressed as the mean ± SD, from at least three independent experiments, n=15, **P < 0.01; N.S., not significant.
|