
Fig 3
- ID
- ZDB-IMAGE-191230-789
- Publication
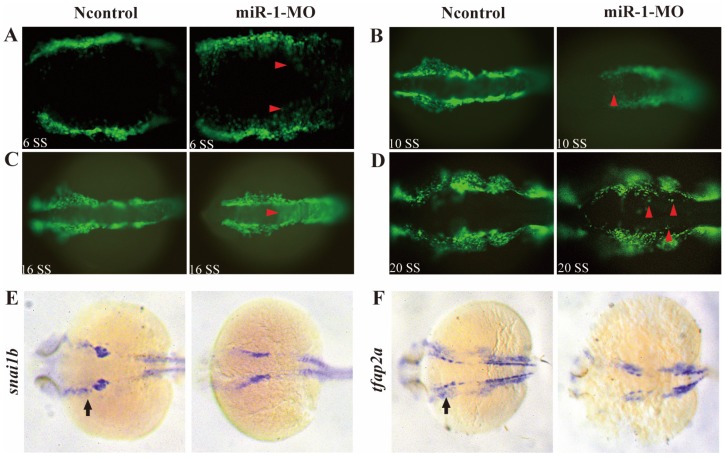
- Wang et al., 2019 - microRNA-1 Regulates NCC Migration and Differentiation by Targeting sec63
- All Figures
- Figures for Wang et al., 2019
|
Fig 3