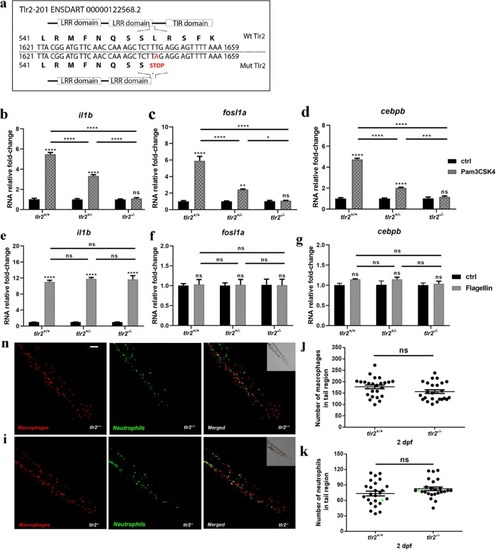
Characterization of the Tlr2 mutant. a mutant DNA and protein sequence. A point mutation (T to A) in the C-terminal of the second LRR domain of zebrafish Tlr2 introduces a premature stop codon. The predicted truncated protein lacks the whole TIR domain. Nucleotide and amino acid positions are indicated with respect to the translation start codon. tlr2+/+, tlr2+/− and tlr2−/− embryos were injected at 27 hpf with 1 ng Pam3CSK4 (b-d) or 0.1 ng flagellin (e-g) and expression levels of il1b, fosl1a and cebpb were determined at 1 h post injection by qPCR. Data (mean ± SEM) are combined from three biological replicates (n = 10 embryos per group) and expressed relative to their corresponding mock injection (water) control (ctrl), which is set at 1. Statistical significance of differences between ctrl and PAMPs injection groups was determined by two-way ANOVA with Tukey’s Multiple Comparison method as a post-hoc test (b-g), ns, non-significant; *, P < 0.05; ***, P < 0.001; ****, P < 0.0001. h, i. Representative Stereo images of the caudal hematopoietic tissue of tlr2+/+Tg (mpeg1:mCherry-F);TgBAC (mpx: EGFP) (h) and tlr2−/−Tg (mpeg1:mCherry-F);TgBAC (mpx: EGFP) (i) were taken at 2 dpf for quantification of macrophages and neutrophils numbers. At 2 dpf, numbers of mCherry-labeled macrophages (j) and GFP-labeled neutrophils (k) were counted using Leica TCS SP8 confocal laser scanning microscopy (CLSM) of transgenic lines. Data (mean ± SEM) were combined from two independent experiments. No significant differences (ns) in the number of macrophages (j) and neutrophils (k) was detected with a t-test

Gene expression in the absence of infection between Tlr2 mutants. a a number of down- and up-regulated genes per method (edgeR and DEseq2) and b a Venn diagram that compares the down-, up- and non-differentially expressed genes per method at a significance level of 10− 10 in the edgeR and DEseq2 analyses methods. Down-regulated means that a gene is less expressed in the tlr2+/− compared to the tlr2−/− strain

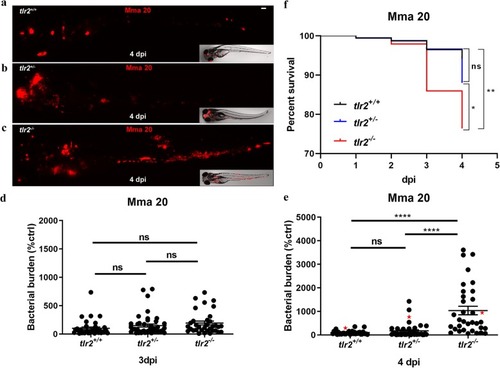
Quantification of bacterial burden and survival after M. marinum infection. tlr2+/+ (a), tlr2+/− (b) and tlr2−/− (c) embryos were infected with mCherry-labeled M. marinum strain Mma20 at a dose of ~ 150 CFU by caudal vein infection at 28 hpf. Representative images for bacterial pixel count in tlr2+/+ (a), tlr2+/− (b) and tlr2−/− (c) were taken at 4 dpi. Bacterial burden of tlr2+/+, tlr2+/− and tlr2−/− were also quantified at 3 dpi (d) and 4 dpi (e). Bacterial burdens were quantified by using bacterial fluorescence pixels. Red stars in (e) indicate the data for the representative images shown in (a-c). In (d, e), data (mean ± SEM) were combined from two independent experiments. Statistical significance of differences was determined by one-way ANOVA with Tukey’s Multiple Comparison method as a post-hoc test for comparison between more than two groups (d, e). Percent of survival curves for tlr2+/+ (n = 47), tlr2+/− (n = 49) and tlr2−/− (n = 49) (f) are based on two independent experiments. Statistical significance of difference was determined by a log-rank (Mantel-Cox) test. ns, non-significant; *, P < 0.05, **, P < 0.01, ****, P < 0.0001

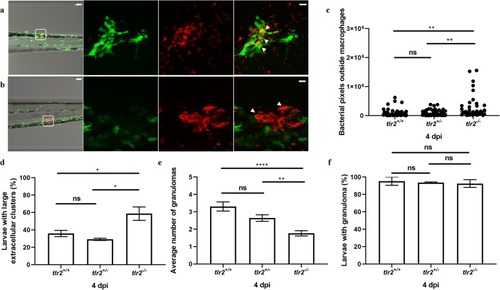
Quantification of Mma20 infection phenotype in the tlr2 mutant. Embryos were infected at 28 hpf with ~ 150 CFU M. marinum Mma20 strain. Confocal images of green fluorescent macrophages and red fluorescent bacteria in a granuloma of tlr2+/+Tg (mpeg1:EGFP) larva (a) and extracellular bacteria in tlr2−/−Tg (mpeg1:EGFP) larva (b) was conducted at 4 dpi with 10 (a, b, bright view images) and 63 (a, b, fluorescent view images) times magnification objectives. White arrowheads indicates a granuloma (a) and extracellular bacteria (b). In the bright view images of (a, b), the scale bar represents 50 μm. In the fluorescent view images of (a, b), the scale bar represents 10 μm. For quantification of bacteria outside macrophages by pixel count (c) large extracellular clusters of at least 8 μm diameter (d) and average number of granulomas in the CHT region (e) three groups of at least 37 embryos of tlr2+/+Tg (mpeg1:EGFP), tlr2+/−Tg (mpeg1:EGFP) and tlr2−/−Tg (mpeg1:EGFP) embryos were analysed at 4 dpi in the CHT region. For these CLSM analyses, 20 times magnification was used (Additional file 4: Figure S4 gives representative images). In panel f the percentage of embryos with at least one granuloma in the CHT region is shown. Statistical significance of differences was determined by one-way ANOVA with Tukey’s Multiple Comparison method as a post-hoc test for comparison between more than two groups (c-f). ns, non-significant; * P < 0.05; ** P < 0.01, **** P < 0.0001

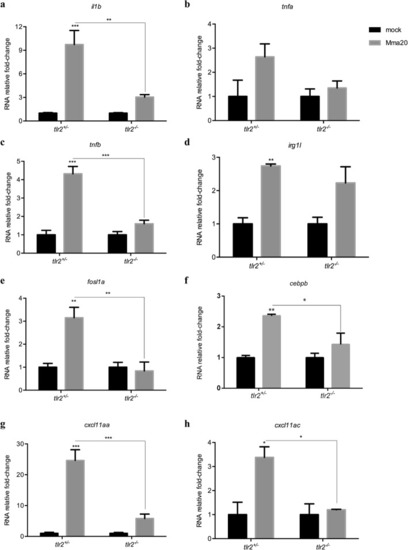
Immune genes expression in tlr2+/− and tlr2−/− fish lines infected with Mm. The expression levels of il1b (a), tnfa (b), tnfb (c), irg1l (d), fosl1a (e), cebpb (f), cxcl11aa (g) and cxcl11ac (h) were determined at 4dpi by qPCR. Data (mean ± SEM) are derived from at least three biological replicates (n = 10 embryos per group) and expressed relative to their corresponding mock injection (PBS) control, which is set at 1. Statistical significance of differences was determined by two-way ANOVA with Tukey’s Multiple Comparison test as a post-hoc test. *P < 0.05, **P < 0.01, ***P < 0.001

Overview of RNAseq results. a, b the number of DEGs of tlr2+/− and tlr2−/− strains infected with Mm compared to the control at different p-value and fold change. c, the work flow of screening genes of which the regulation by infection is dependent on tlr2. d, GO analysis of the 97 upregulated genes. e, GO analysis of the 92 down-regulated genes. FC, fold-change)

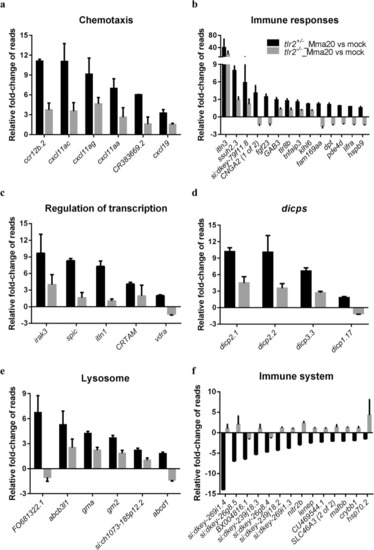
Overview of fold changes of representative genes selected from the gene categories resulting from GO-term analysis. a-e: tlr2-dependent genes with up regulation corresponding to Fig. 6d. f: tlr2 specific genes with down regulation corresponding to Fig. 6e

Acknowledgments
This image is the copyrighted work of the attributed author or publisher, and ZFIN has permission only to display this image to its users. Additional permissions should be obtained from the applicable author or publisher of the image. Full text @ BMC Genomics