
IMAGE
Fig. 5
- ID
- ZDB-IMAGE-191230-50
- Genes
- Publication
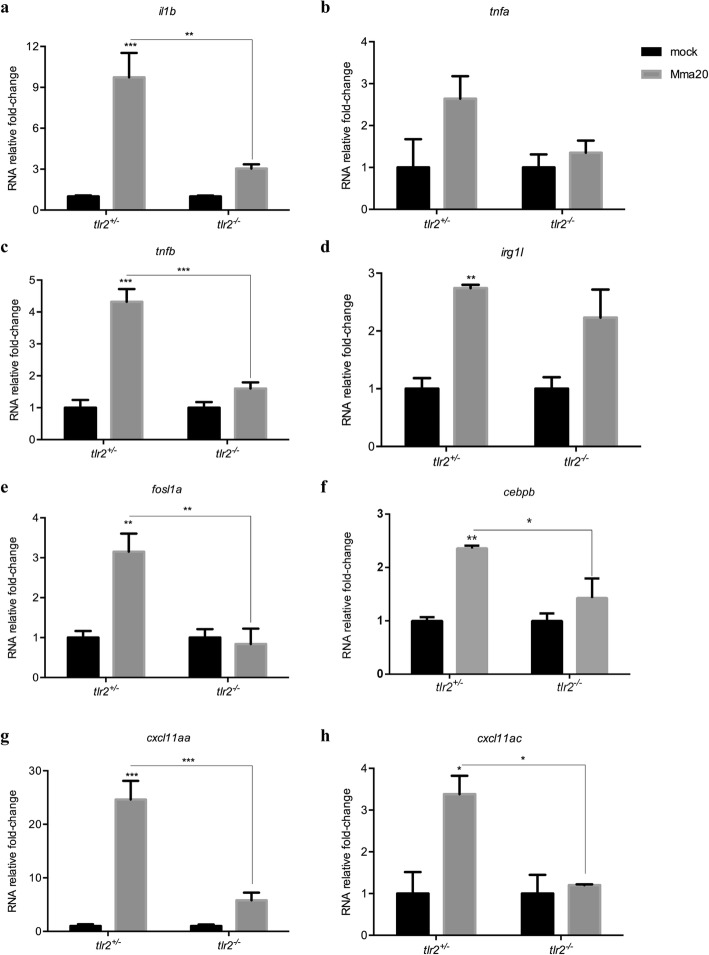
- Hu et al., 2019 - Infection and RNA-seq analysis of a zebrafish tlr2 mutant shows a broad function of this toll-like receptor in transcriptional and metabolic control and defense to Mycobacterium marinum infection
- All Figures
- Figures for Hu et al., 2019
Image
|
Figure Caption
Fig. 5
Immune genes expression in
Figure Data
Acknowledgments
This image is the copyrighted work of the attributed author or publisher, and
ZFIN has permission only to display this image to its users.
Additional permissions should be obtained from the applicable author or publisher of the image.
Full text @ BMC Genomics