FIGURE SUMMARY
Title

Microplastics induce transcriptional changes, immune response and behavioral alterations in adult zebrafish

Authors
Limonta, G., Mancia, A., Benkhalqui, A., Bertolucci, C., Abelli, L., Fossi, M.C., Panti, C.
Source
Full text @ Sci. Rep.

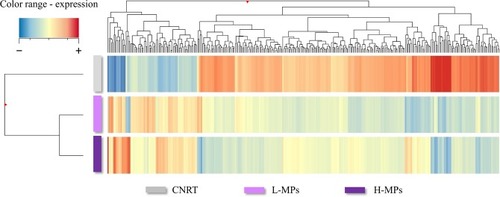
Hierarchical cluster of the differentially expressed genes across treatments. Genes and samples are clustered by similarity of expression (top and left, respectively). CNTR (control); L-MPs (100 µg/L); H-MPs (1000 µg/L).

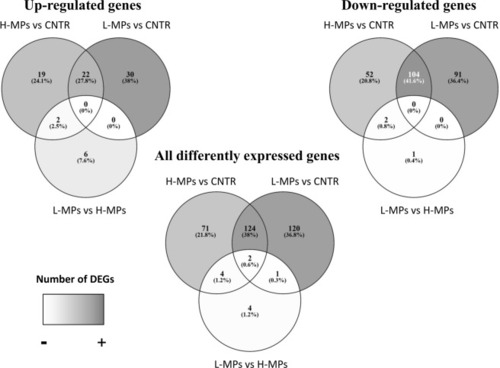
Venn diagrams showing the number of DEGs after 20 days of MPs exposure. The number of all DEGs, up-regulated genes and down-regulated genes are shown for every comparison: H-MPs (1000 µg/L) vs CNTR (Control), L-MPs (100 µg/L) vs CNTR (Control) and L-MPs (100 µg/L) vs H-MPs (1000 µg/L).

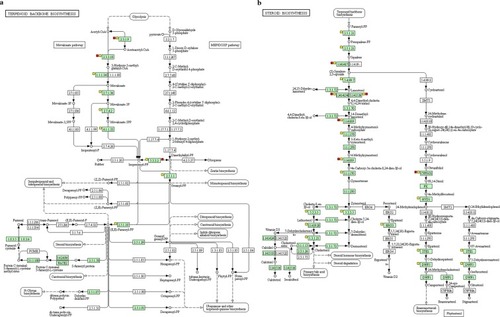
KEGG pathways involved in the lipid methabolism of zebrafish enriched after MPs exposure. (a) Terpenoid backbone biosynthesis (L-MPs FDR = 2.40E-07; H-MPs FDR = 0.191679). (b) Steroid biosynthesis (L-MPs FDR = 1.11E-08; H-MPs FDR = 0.228282). Green boxes represent genes involved in the organism-specific pathway for Danio rerio. Yellow squares next to the pathway steps indicate genes that are down-regulated transcribed after L-MPs exposure (100 µg/L). Red squares next to the pathway steps indicate genes that are down-regulated transcribed after H-MPs exposure (1000 µg/L). Pathway images obtained from KEGG50,51.

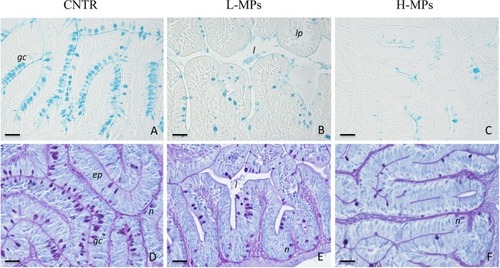
Histology of gastrointestinal tract (GIT). Representative sections of intestines stained with AB (A–C) or PAS with HH nuclear counterstain (D–F). CNTR (Control) in (A,D); L-MPs (100 µg/L) in (B and E); H-MPs (1000 µg/L) in (C,F). Gc: goblet cells; l: lumen; lp: lamina propria; ep: epithelium; n: neutrophils. Scale bar: 50 µm.

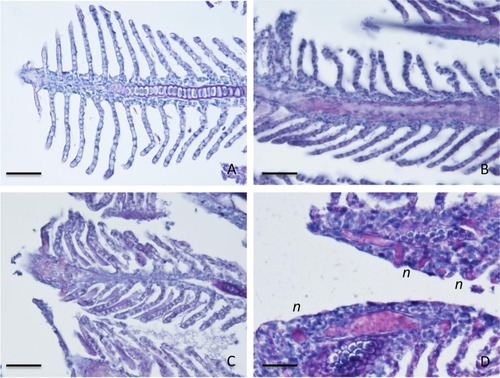
Histology of gills. Representative sections of gill lamellae stained with PAS with HH nuclear counterstain. CNTR (Control) in (A); L-MPs (100 µg/L) in (B); H-MPs (1000 µg/L) in (C). Note in (D) (L-MPs) high occurrence of neutrophils (n). Scale bar: 50 µm.

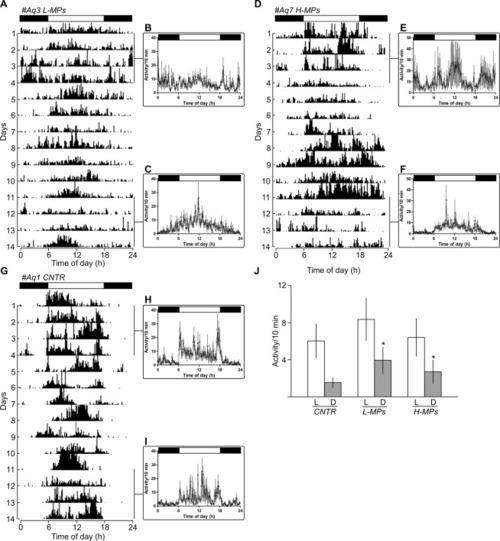
The daily activity rhythm of zebrafish is affected by MPs. Representative actograms (A,D,G) and mean waveforms of locomotor activity (B,C,E,F,H,I) in zebrafish housed under a 12:12 LD cycle. The white and black bars at the top of the graphs indicate the light and dark periods, respectively. In actograms the height of each point represents the number of infrared light-beam interruptions per 10 min. In mean waveforms, each point was calculated as the mean ± SD from the 10-minute binned data across 4 experimental days. (J) Amount of activity (mean ± SD) measured during photophases (white bars) and scotophases (gray bars) in the different experimental conditions. *p < 0.05

Acknowledgments
This image is the copyrighted work of the attributed author or publisher, and ZFIN has permission only to display this image to its users. Additional permissions should be obtained from the applicable author or publisher of the image. Full text @ Sci. Rep.