FIGURE

Figure 6

ID
ZDB-FIG-191230-1007
Publication
Limonta et al., 2019 - Microplastics induce transcriptional changes, immune response and behavioral alterations in adult zebrafish
Other Figures
All Figure Page
Back to All Figure Page
Figure 6

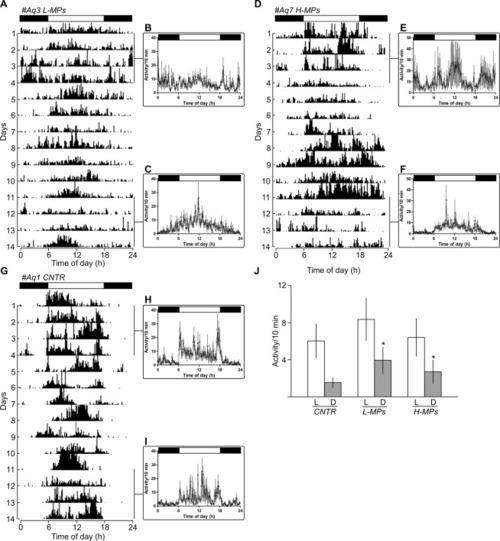
The daily activity rhythm of zebrafish is affected by MPs. Representative actograms (A,D,G) and mean waveforms of locomotor activity (B,C,E,F,H,I) in zebrafish housed under a 12:12 LD cycle. The white and black bars at the top of the graphs indicate the light and dark periods, respectively. In actograms the height of each point represents the number of infrared light-beam interruptions per 10 min. In mean waveforms, each point was calculated as the mean ± SD from the 10-minute binned data across 4 experimental days. (J) Amount of activity (mean ± SD) measured during photophases (white bars) and scotophases (gray bars) in the different experimental conditions. *p < 0.05

Expression Data

Expression Detail
Antibody Labeling
Phenotype Data

Phenotype Detail
Acknowledgments
This image is the copyrighted work of the attributed author or publisher, and ZFIN has permission only to display this image to its users. Additional permissions should be obtained from the applicable author or publisher of the image. Full text @ Sci. Rep.