
Image
|
Figure Caption
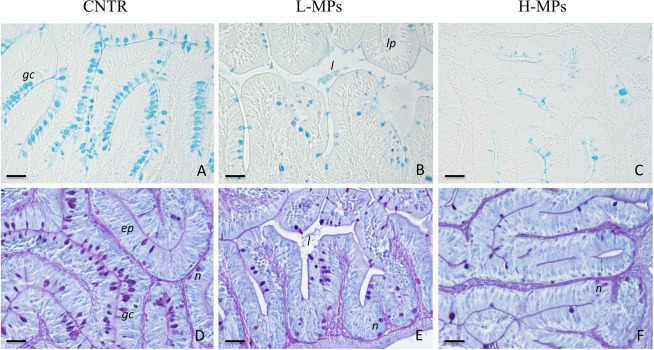
Figure 4
Histology of gastrointestinal tract (GIT). Representative sections of intestines stained with AB (
Acknowledgments
This image is the copyrighted work of the attributed author or publisher, and
ZFIN has permission only to display this image to its users.
Additional permissions should be obtained from the applicable author or publisher of the image.
Full text @ Sci. Rep.