
FIGURE
Figure 2
- ID
- ZDB-FIG-191230-1003
- Publication
- Limonta et al., 2019 - Microplastics induce transcriptional changes, immune response and behavioral alterations in adult zebrafish
- Other Figures
- All Figure Page
- Back to All Figure Page
Figure 2
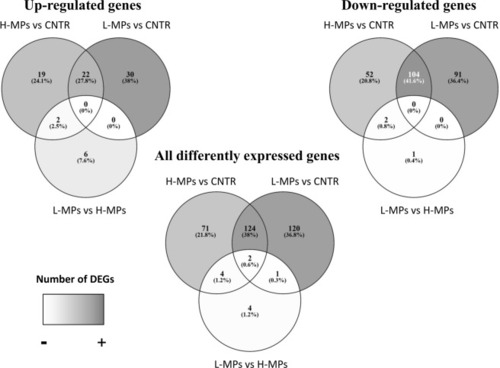
Venn diagrams showing the number of DEGs after 20 days of MPs exposure. The number of all DEGs, up-regulated genes and down-regulated genes are shown for every comparison: H-MPs (1000 µg/L) vs CNTR (Control), L-MPs (100 µg/L) vs CNTR (Control) and L-MPs (100 µg/L) vs H-MPs (1000 µg/L). |
Expression Data
Expression Detail
Antibody Labeling
Phenotype Data
Phenotype Detail
Acknowledgments
This image is the copyrighted work of the attributed author or publisher, and
ZFIN has permission only to display this image to its users.
Additional permissions should be obtained from the applicable author or publisher of the image.
Full text @ Sci. Rep.