IMAGE

Figure 3

ID
ZDB-IMAGE-191230-1023
Source
Figures for Limonta et al., 2019
Image
Figure Caption

Figure 3

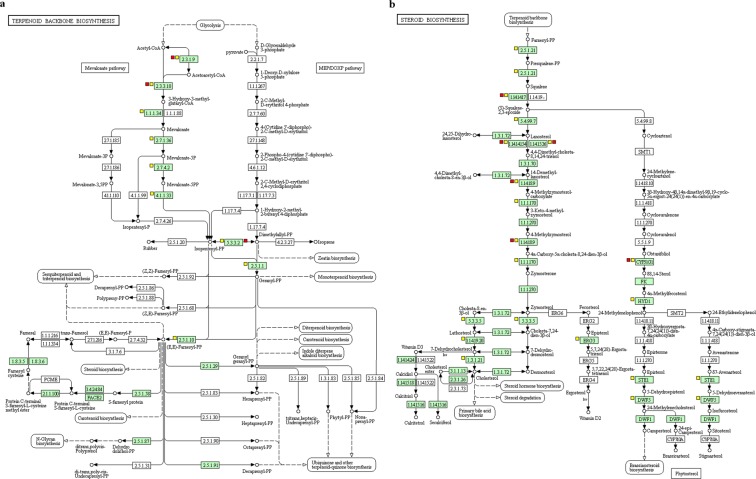
KEGG pathways involved in the lipid methabolism of zebrafish enriched after MPs exposure. (a) Terpenoid backbone biosynthesis (L-MPs FDR = 2.40E-07; H-MPs FDR = 0.191679). (b) Steroid biosynthesis (L-MPs FDR = 1.11E-08; H-MPs FDR = 0.228282). Green boxes represent genes involved in the organism-specific pathway for Danio rerio. Yellow squares next to the pathway steps indicate genes that are down-regulated transcribed after L-MPs exposure (100 µg/L). Red squares next to the pathway steps indicate genes that are down-regulated transcribed after H-MPs exposure (1000 µg/L). Pathway images obtained from KEGG50,51.

Acknowledgments
This image is the copyrighted work of the attributed author or publisher, and ZFIN has permission only to display this image to its users. Additional permissions should be obtained from the applicable author or publisher of the image. Full text @ Sci. Rep.