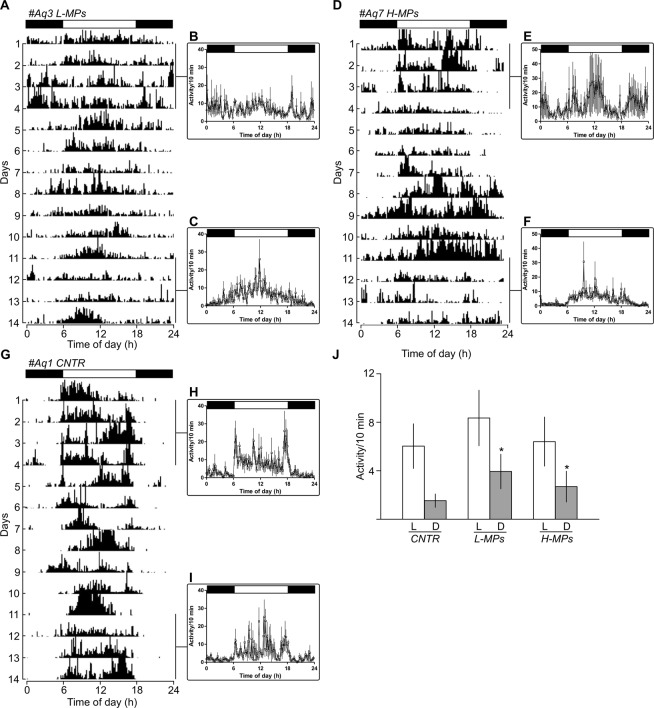
The daily activity rhythm of zebrafish is affected by MPs. Representative actograms (A,D,G) and mean waveforms of locomotor activity (B,C,E,F,H,I) in zebrafish housed under a 12:12 LD cycle. The white and black bars at the top of the graphs indicate the light and dark periods, respectively. In actograms the height of each point represents the number of infrared light-beam interruptions per 10 min. In mean waveforms, each point was calculated as the mean ± SD from the 10-minute binned data across 4 experimental days. (J) Amount of activity (mean ± SD) measured during photophases (white bars) and scotophases (gray bars) in the different experimental conditions. *p < 0.05
Acknowledgments
This image is the copyrighted work of the attributed author or publisher, and
ZFIN has permission only to display this image to its users.
Additional permissions should be obtained from the applicable author or publisher of the image.
Full text @ Sci. Rep.
Your Input Welcome
Thank you for submitting comments. Your input has been emailed to ZFIN curators who may contact you if
additional information is required.
Oops. Something went wrong. Please try again later.