FIGURE SUMMARY
Title

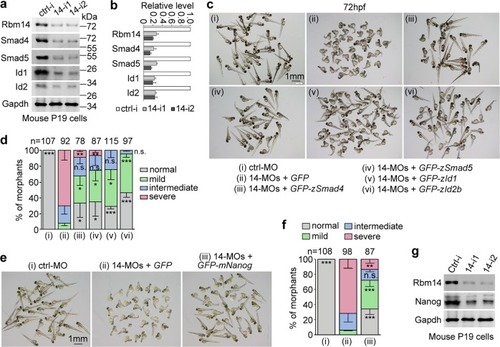
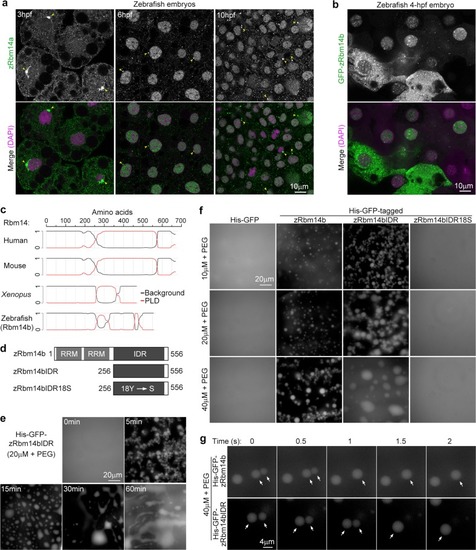
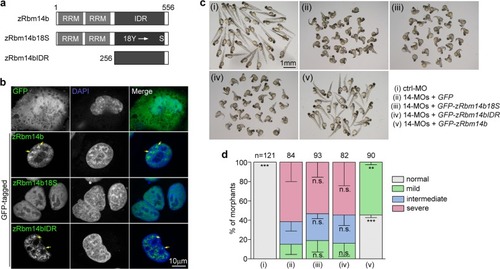
Regulation of zebrafish dorsoventral patterning by phase separation of RNA-binding protein Rbm14

Authors
Xiao, Y., Chen, J., Wan, Y., Gao, Q., Jing, N., Zheng, Y., Zhu, X.
Source
Full text @ Cell Discov

Zebrafish <italic>rbm14</italic> morphants display dorsalized phenotypes.

arbm14 was downregulated during embryogenesis. Total mRNAs were extracted from 50 zebrafish embryos at 0 or 10 hpf. The expression levels of rbm14a and rbm14b were analyzed by qPCR. β-Actin was used as internal control. qPCR results from two independent experiments are presented as mean ± SD. b Total protein levels of zRbm14a increased during early embryonic development. Zebrafish embryos at the indicated stages were removed of the yolk and subjected to immunoblotting. Proteins from 8 embryos were loaded in each lane. c Immunofluorescent staining of zRbm14 in zebrafish embryos. Nuclear DNA was stained by DAPI. The animal and vegetal poles and ventral (v) and dorsal (d) sides are marked in the bright-field images. d Embryo morphologies at the indicated developmental stages. Zebrafish embryos at the one-cell stage were injected with a control morpholino oligonucleotide (ctrl-MO; 8 ng per embryo) or two MOs specific to rbm14a and rbm14b, respectively (14-MOs; 4 ng each per embryo) (see Supplementary Fig. 2a–e). e Quantification results for the experiments in d, based on the criteria and examples shown. f, g Exogenous zRbm14b rescued the dorsalized phenotypes. Zebrafish embryos at the one-cell stage were co-injected with the indicated MOs (total 8 ng per embryo) and in vitro-transcribed mRNA (also see Supplementary Fig. 1f). The morphants were examined at 72 hpf. Those injected with ctrl-MO served as negative control. Data in e and g, presented as mean ± SD, were from three independent experiments. Student’s t-test against the ctrl-MO-injected populations: n.s., no significance (P > 0.05); *P < 0.05; **P < 0.01; ***P < 0.001. Total numbers of embryos analyzed are listed over histograms. h, i The rbm14 morphants show defective dorsoventral patterning. Zebrafish embryos microinjected as in d were subjected to mRNA in situ hybridization at the 75–90% epiboly stages (h) and quantified (i). Total numbers of embryos analyzed are listed over each histogram

The ventralization defects of <italic>rbm14</italic> morphants is mainly attributed to insufficient BMP signaling.

a, b Knockdown of mRbm14 in P19 cells concomitantly downregulated Smad4, Smad5, Id1, and Id2. P19 cells transfected with control siRNA (ctrl-i) or each of the two mRbm14-specific siRNAs (14-i1 and 14-i2) for 48 h were collected and subjected to immunoblotting. Gapdh served as a loading control. The quantification results (b), presented as mean ± SD, were based on band intensities from two independent experiments. c, d Overexpressing smad4, smad5, id1, or id2b attenuated the ventralization defects of rbm14 morphants. Zebrafish embryos at the one-cell stage were co-injected with the indicated MOs (total 8 ng per embryo) and in vitro-transcribed mRNA (300 pg per embryo) coding for GFP or the GFP-tagged proteins (also see Supplementary Fig. 2). Those injected with ctrl-MO served as a negative control. e, f Overexpressing Nanog attenuates the ventralization defect of zebrafish rbm14 morphants. Zebrafish embryos at the one-cell stage were co-injected with the indicated MOs (total 8 ng per embryo) and in vitro-transcribed mRNA coding for GFP or GFP-mNanog (300 pg per embryo) (also see Supplementary Fig. 2). Embryos injected with ctrl-MO served as a negative control. Quantification results (d, f), based on the criteria and examples in Fig. 1e and presented as mean ± SD, were from three independent experiments. Student’s t-test against the GFP mRNA-injected populations: n.s., no significance (P > 0.05); *P < 0.05; **P < 0.01; ***P < 0.001. Total number of embryos analyzed are listed over each histogram. g Depletion of Rbm14 in P19 cells downregulated Nanog. P19 cells transfected with the indicated siRNAs for 48 h were subjected to immunoblotting. Gapdh served as a loading control

zRbm14 distributes in cells as puncta and forms liquid droplets in vitro through IDR.

a zRbm14a displayed punctate distributions in the cytoplasm and nucleus of zebrafish embryonic cells. Zebrafish embryos immunostained as in Fig. 1c were imaged at high resolution. Arrowheads indicate bright perinuclear zRbm14a puncta. b GFP-zRbm14b displayed similar subcellular localizations as endogenous zRbm14a. Zebrafish embryos were microinjected at the one-cell stage with in vitro-transcribed mRNA (800 pg per embryo) to express GFP-zRbm14b, fixed at approximately 4 hpf, and imaged at high resolution. c PLD prediction for Rbm14 orthologues. The diagrams were generated by using the Prion-like Amino Acid Composition (PLAAC) program (http://plaac.wi.mit.edu)1. Sequences with the PLD probability >0.5 (y-axis) are considered as a PLD. d Diagrams of His-GFP-tagged zRbm14b and its mutants. Detailed mutation sites in zRbm14bIDR18S are indicated in Supplementary Fig. 3a. e Time-dependent droplet growth. Twenty micromolar of His-GFP-zRbm14bIDR containing 1% PEG8000 were incubated at 25 °C for the indicated time and imaged for GFP fluorescence. f Concentration-dependent droplet formation. Ten to 40 μM of purified His-GFP or its tagged proteins containing 1% PEG8000 were shifted from ice to 25 °C for 5 min and imaged. Also see Supplementary Fig. 3b, c. g Image sequences showing fusion processes of two droplets (arrows)

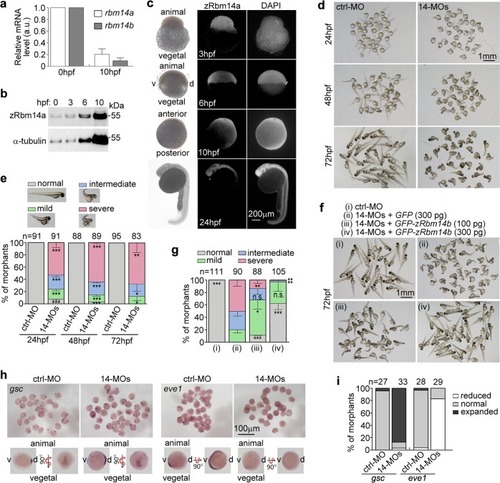
EXPRESSION / LABELING:
Gene:
Fish:
Anatomical Term:
Stage Range: 1k-cell to Bud

The phase separation property and RRM region of zRbm14b are both essential for proper dorsoventral patterning.

a Diagrams of zRbm14b and its mutants. Detailed mutation sites in zRbm14b18S are provided in Supplementary Fig. 3a. b Subcellular localizations of GFP-tagged zRbm14b, zRbm14b18S, and zRbm14bIDR in HeLa cells. HeLa cells were transfected for 48 h with the intact plasmids for the in vitro mRNA productions (c). Nuclear DNA was stained with DAPI. Arrows indicate typical nuclear puncta. c, d zRbm14b18S and zRbm14bIDR failed to rescue the dorsalized phenotypes of rbm14 morphants. Zebrafish embryos at the one-cell stage were co-injected with 14-MOs (total 8 ng per embryo) and in vitro-transcribed mRNA (300 pg mRNA per embryo) coding for GFP, GFP-zRbm14b, GFP-zRbm14b18S, or GFP-zRbm14bIDR (also see Supplementary Figs. 1f and 4a). Embryos injected with 8 ng of ctrl-MO served as a negative control. The samples were imaged at 72 hpf (c). The quantification results (d), based on the criteria and examples in Fig. 1e and represented as mean ± SD, were from three independent experiments. Student’s t-test against the GFP mRNA-injected populations: n.s., no significance; **P < 0.01; ***P < 0.001. Total number of embryos analyzed are listed over each histogram

The IDR of zRbm14b can be functionally replaced with other phase separation domains in vivo.

a Diagrams of chimeric proteins examined. RRM, the RRM region of zRbm14b; NLS, the nuclear localization signal of large T antigen; xBuGZΔN, the IDR of xBuGZ; zFusPLD, zEwsr1bPLD, or zTaf15PLD, the PLD domain of zebrafish Fus, Ewsr1b, or Taf15 (also see Supplementary Fig. 4e). Numbers indicate amino acid positions in each intact protein. b Subcellular localization of the indicated GFP-tagged proteins. HeLa cells were transfected with the intact plasmids used for in vitro mRNA productions (c) for 48 h and fixed with 4% paraformaldehyde. Nuclear DNA was stained with DAPI. Arrows indicate representative nuclear foci. c, d The phase separation domains of xBuGZ, zFus, zEwsr1b, and zTaf15 were partially redundant to the IDR of zRbm14b. Zebrafish embryos at the one-cell stage were co-injected with 14-MOs (8 ng per embryo) and the indicated in vitro-transcribed mRNA (300 pg mRNA per embryo) (also see Supplementary Fig. 4d, f) and imaged at 72 hpf (c). The quantification results (d), based on the criteria and examples in Fig. 1e and represented as mean ± SD, were from three independent experiments. Student’s t-test against the GFP mRNA-injected populations: n.s., no significance; *P < 0.05; **P < 0.01; ***P < 0.001. Total numbers of embryos analyzed are listed over the histogram

Rbm14 partitions into RNP compartments and complex with RNA-binding proteins important for RNA metabolism.

a, b The nucleoplasmic puncta (arrowheads) of endogenous human Rbm14 and exogenous zRbm14b were sensitive to RNA pol II activity. HeLa cells that were untransfected (a) or transiently transfected to express GFP-zRbm14b (b) were treated with actinomycin D for 60 min prior to fixation. Nuclear DNA was visualized with DAPI. Arrows indicate fluorescent signals at nucleolar caps. c Human Rbm14 localized to stress granules (SGs; arrows). HeLa cells were treated with sodium arsenite to induce SGs. Untreated cells were used as control. eIF3b served as an SG marker. d zRbm14b translocated into SGs (arrows) through phase separation. HeLa cells transiently expressing the indicated zRbm14b mutants were treated with sodium arsenite. e Mouse Rbm14 associated with large protein complexes. Flag-GFP and Flag-mRbm14 expressed in mouse embryonic stem cells were immunoprecipitated using anti-Flag resin. The immunoprecipitates were resolved by SDS-PAGE and silver stained. f The top 10 hits of potential Rbm14-associated proteins. The immunoprecipitates of Flag-GFP and Flag-Rbm14 were subjected to shotgun mass spectrometric analysis. The top ten hits identified exclusively from the latter sample, according to total peptide count, are listed. g Top ten gene ontology (GO) term hits on candidate Rbm14-associated proteins. Only proteins identified exclusively in the Flag-mRbm14 sample were used for the analysis. h zRbm14b also associated with hnRNP proteins. GFP-tagged mRbm14 and zRbm14b expressed in HeLa cells were immunoprecipitated using anti-GFP resin and immunoblotted to detect the indicated proteins

Zebrafish <italic>rbm14</italic> morphants display transcriptomic downregulation and alternative splicing.

a A heat map of differentially expressed genes in control (ctrl-MO) and rbm14 (14-MOs) morphants at 10 or 24 hpf. b The principal component analysis to show variance in the gene expression profiles of the control and rbm14 morphants. We found that the first principal component (PC1) explains 92.2% of the variance, while PC2 and PC3 explain 6.0% and 1.6%, respectively. c The top 10 GO term events of the differentially expressed genes. d A heat map of smads, ids, and nanog transcripts. e A heat map of transcripts of 81 ribosomal protein genes. In cases when multiple Ensembls corresponded to the same gene, only the one with the highest transcript levels was used for analysis. f Analysis of differential AS events in the rbm14 morphants. SE, skipped exon; A3SS, alternative 3′ splicing site; A5SS, alternative 5′ splicing site; MXE, mutually exclusive exon; RI, retained intron

ZFIN is incorporating published figure images and captions as part of an ongoing project. Figures from some publications have not yet been curated, or are not available for display because of copyright restrictions.

Acknowledgments
This image is the copyrighted work of the attributed author or publisher, and ZFIN has permission only to display this image to its users. Additional permissions should be obtained from the applicable author or publisher of the image. Full text @ Cell Discov