|
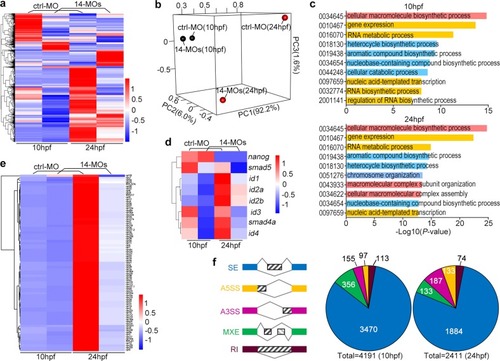
Zebrafish <italic>rbm14</italic> morphants display transcriptomic downregulation and alternative splicing.a A heat map of differentially expressed genes in control (ctrl-MO) and rbm14 (14-MOs) morphants at 10 or 24 hpf. b The principal component analysis to show variance in the gene expression profiles of the control and rbm14 morphants. We found that the first principal component (PC1) explains 92.2% of the variance, while PC2 and PC3 explain 6.0% and 1.6%, respectively. c The top 10 GO term events of the differentially expressed genes. d A heat map of smads, ids, and nanog transcripts. e A heat map of transcripts of 81 ribosomal protein genes. In cases when multiple Ensembls corresponded to the same gene, only the one with the highest transcript levels was used for analysis. f Analysis of differential AS events in the rbm14 morphants. SE, skipped exon; A3SS, alternative 3′ splicing site; A5SS, alternative 5′ splicing site; MXE, mutually exclusive exon; RI, retained intron
|